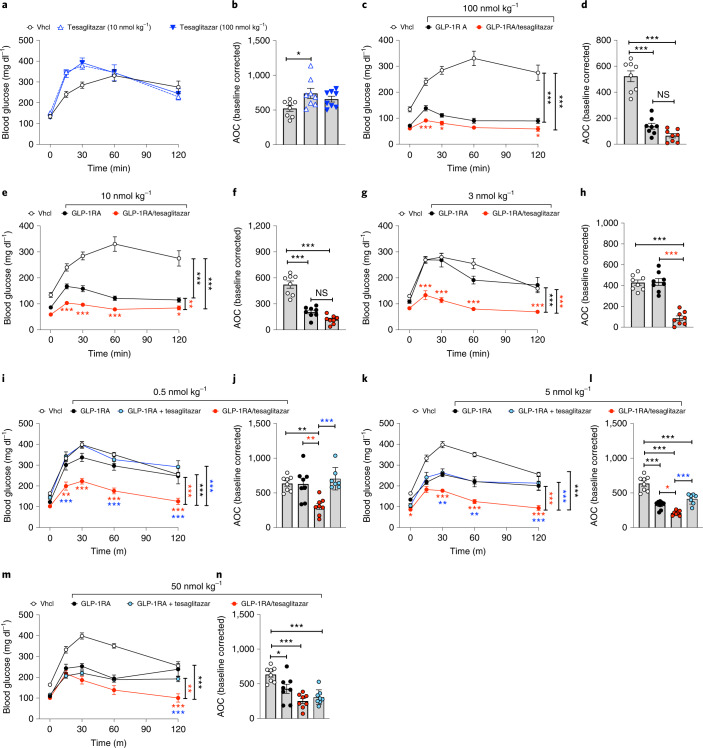
Fig. 3. Acute glycaemic effects of GLP-1RA/tesaglitazar in DIO mice.
a–h, i.p. GTT in 34-week-old male naïve DIO mice 6 h after treatment with a single s.c. dose of tesaglitazar (10 (a) or 100 nmol kg−1 (b)), or with the GLP-1RA or GLP-1RA/tesaglitazar at a dose of 100 nmol kg−1 (c,d), 10 nmol kg−1 (e,f) or 3 nmol kg−1 (g,h). i–n, i.p. GTT in 27–29-week-old male DIO mice 6 h after single s.c. treatment at doses of 0.5 nmol kg−1 (i,j), 5 nmol kg−1 (k,l) or 50 nmol kg−1 (m,n). In a–h, sample sizes are n = 8 mice each treatment group. In i–n, sample sizes for treatment with Vhcl, GLP-1RA, GLP-1RA + tesaglitazar and GLP-1RA/tesaglitazar are n = 8/8/8/7 mice (i,j,m,n), n = 8/8/8/8 mice (k) and n = 8/8/7/7 mice (l). Data represent means ± s.e.m. Data in a, c, e, g, I, k and m have been analysed by two-way ANOVA with Bonferroni post hoc comparison for individual time points. Data in b, d, f, h, j, l and n have been analysed by one-way ANOVA using Bonferroni’s multiple comparison test. Asterisks indicate *P < 0.05, **P < 0.01, ***P < 0.001. Black asterisks indicate comparison to Vhcl, red asterisks indicate comparison to GLP-1RA, blue asterisks indicate comparison to the GLP-1RA + tesaglitazar cotherapy. Exact P values for treatment effects are b P = 0.0199; c both P < 0.0001; d both P < 0.0001; e P = 0.0056, P < 0.0001 and P < 0.0001; f both P < 0.0001; g both P < 0.0001; h both P < 0.0001; i all P < 0.0001; j P = 0.0021 (black asterisks), P = 0.0027 (red asterisks), P = 0.0003 (blue asterisks); k P = 0.0011 (red asterisks), P < 0.0001 (blue asterisks) and P < 0.0001 (black asterisks); l P = 0.0388 (red asterisks), P = 0.0002 (blue asterisks), P < 0.0001 (Vhcl versus all other groups); m P = 0.0036 (red asterisks), P < 0.0001 (black asterisks); n P = 0.0229, P = 0.0002 (Vhcl versus GLP-1RA + tesaglitazar), P < 0.0001 (Vhcl versus GLP-1RA/tesaglitazar). For exact P values at individual time points (b,e,g,i,k,m), see the data source file.

