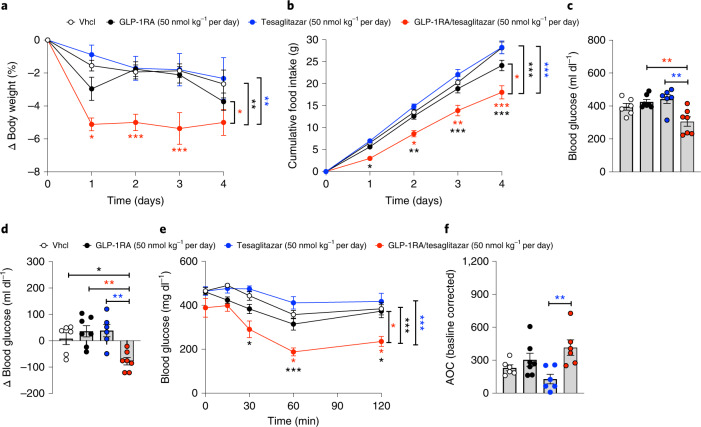
Fig. 6. GLP-1RA/tesaglitazar effects in obese db/db mice.
a–f, Body weight (a), cumulative food intake (b), plasma glucose (c), change in blood glucose (d) and glucose tolerance (e,f) in 6-week-old obese db/db mice treated for 4 days at a dose of 50 nmol kg−1 per day. Sample sizes for treatment with Vhcl, GLP-1RA, tesaglitazar or GLP-1RA/tesaglitazar are n = 6/7/6/7 (a,c,d) and n = 6/7/6/6 (e,f). Cumulative food intake was assessed per cage in n = 4/4/4/4 cages containing n = 6/7/6/7 mice (b). Data in a, b and e have been analysed by two-way ANOVA with Bonferroni post hoc comparison for individual time points. Data in c, d and f have been analysed by one-way ANOVA using the Bonferroni’s multiple comparison test. Data represent means ± s.e.m.; asterisks indicate *P < 0.05, **P < 0.01, ***P < 0.001. Black asterisks indicate comparison to Vhcl, red asterisks indicate comparison to GLP-1RA, blue asterisks indicate comparison to tesaglitazar. Exact P values for treatment effects are: a, P = 0.0353 (red asterisk), P = 0.0078 (black asterisks) and P = 0.0031 (blue asterisks); b, P = 0.0112 (red asterisk), P = 0.0007 (black asterisks) and P = 0.0002 (blue asterisks); c, P = 0.0062 (red asterisks) and P = 0.0025 (blue asterisks); d, P = 0.0409 (black asterisk), P = 0.0027 (red asterisks) and P = 0.0032 (blue asterisks); e, P = 0.0165 (red asterisk), P = 0.0009 (black asterisks) and P = 0.0002 (blue asterisks); f, P = 0.0075. For exact P values at individual time points (a,b,e), see the data source file.

