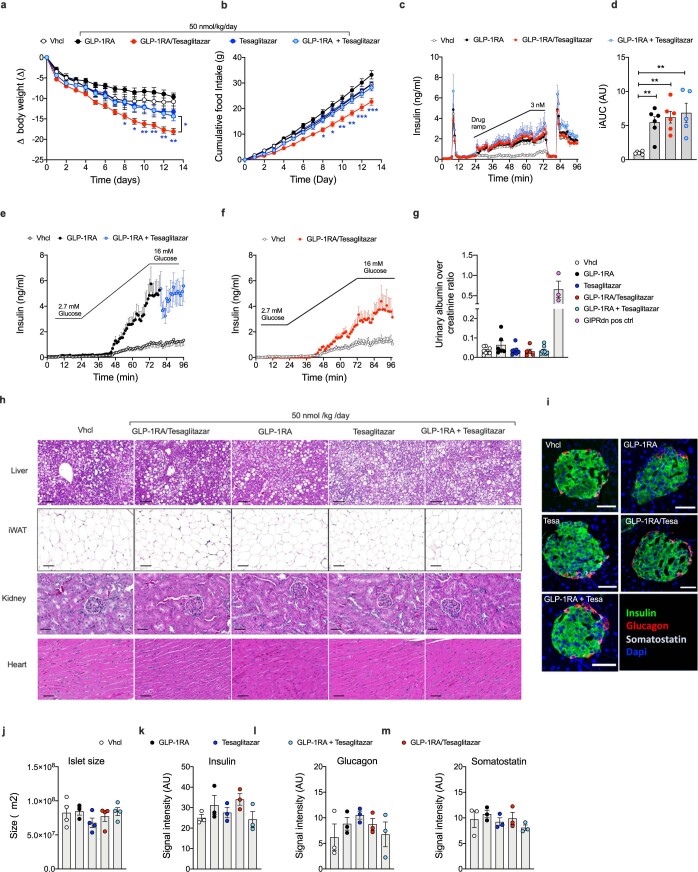
Extended Data Fig. 2. Effects of GLP-1RA/Tesaglitazar relative to GLP-1RA + Tesaglitazar co-therapy.
Change in body weight (a) and food intake (b) of 47-wk old male DIO C57BL6/J mice treated daily s.c. with Vhcl (n = 8 mice) or 50 nmol/kg of either GLP-1RA (n = 7 mice), Tesaglitazar (n = 8 mice), GLP-1RA/Tesaglitazar (n = 8 mice) or GLP-1RA + Tesaglitazar (n = 8 mice). Cumulative food intake was assessed per cage in n = 4/4/4/4 cages containing n = 8/7/8/8 mice (b). Glucose-stimulated insulin secretion in islets isolated from n = 10 male 18-wk old C57BL6/J mice (Run 1) and n = 10 female 12-wk old C57BL/6 J mice (Run 2), and which were treated with either control, GLP-1RA, GLP-1/Tesaglitazar or GLP-1RA + Tesaglitazar (n = 6/6/6/5 biologically independent replicates) under dynamic drug concentrations up to 3 nM under glucose concentrations of 10 mM (c,d). Data in (c,d) represent combined results from the two independent runs. Islets were pooled and separated randomly between the treatment groups. After 4 min of low glucose (2.7 mM), levels of glucose were increased to 10 mM at t = 5 min. The peak at t = 10 min represents 1st phase insulin secretion, the peak at t = 80 min represents treatment with 2.7 mM glucose + 30 mM KCL (c,d). Glucose-stimulated insulin secretion in pooled islets isolated from 10–15-wk old male (n = 9) and female (n = 6) C57BL6/J mice treated with either control, GLP-1RA or GLP-1RA + Tesaglitazar (n = 9/6/6 biologically independent biological replicates) (e) or with control or GLP-1RA/Tesaglitazar (n = 9/6 independent biological replicates) (f) under dynamic glucose concentrations ranging from 2.7–16 mM at drug concentrations of 3 nM. Urinary albumin over creatinine ratio in 49-wk old male DIO C57BL6/J mice after 14 days of daily s.c. treatment with Vhcl or 50 nmol/kg of either GLP-1RA/Tesaglitazar, GLP-1RA, Tesaglitazar, GLP-1RA + Tesaglitazar (n = 8/5/6/7/8 mice) (g). Urinary samples of a mouse model for diabetic nephropathy (GIPRdn)32 (n = 3 mice) serves as positive control (g). Representative images of histopathological analysis of liver, iWAT, kidney and heart in 49-wk old male DIO C57BL6/J mice after 14 days of daily s.c. treatment with 50 nmol/kg (scale bar liver/iWAT: 100 µm, kidney/heart: 50 µm) (h). Representative confocal images of pancreatic sections obtained in 49-wk old male DIO C57BL6/J mice after 14 days of daily s.c. treatment with 50 nmol/kg and stained for different pancreatic hormones (scale bar 50 μm) (i). Pancreatic islet size (j) and hormone content between different groups (k-m) of 49-wk old male DIO C57BL6/J mice after 14 days of daily s.c. treatment with Vhcl or 50 nmol/kg of either GLP-1RA, Tesaglitazar, GLP-1RA + Tesglitazar or GLP-1RA/Tesaglitazar. Sample sizes are n = 4/3/4/4/4 mice (j) and n = 3/3/3/3 mice (k-m). Data in panel a and b have been analyzed by 2-way ANOVA using the Bonferroni’s multiple comparison test for individual time points. Data in panel d, g, and j-m have been analyzed by 1-way ANOVA with Bonferroni multiple comparison test. Data represent means ± SEM; asterisks indicate * p < 0.05, ** p < 0.01, *** p < 0.001. Blue asterisks in panel a and b indicate significance of GLP-1RA/Tesaglitazar over the fixed dose combination of the GLP-1RA + Tesaglitazar. Exact p-values for treatment effects are (a) p = 0.0105, (d) p = 0.0089 (Cntrl. vs. GLP-1RA), p = 0.0021 (Cntrl. vs. GLP-1RA/Tesaglitazar), p = 0.0011 (Cntrl. vs. GLP-1RA + Tesaglitazar). For exact p-values at individual time points (a,b) see data source file.

