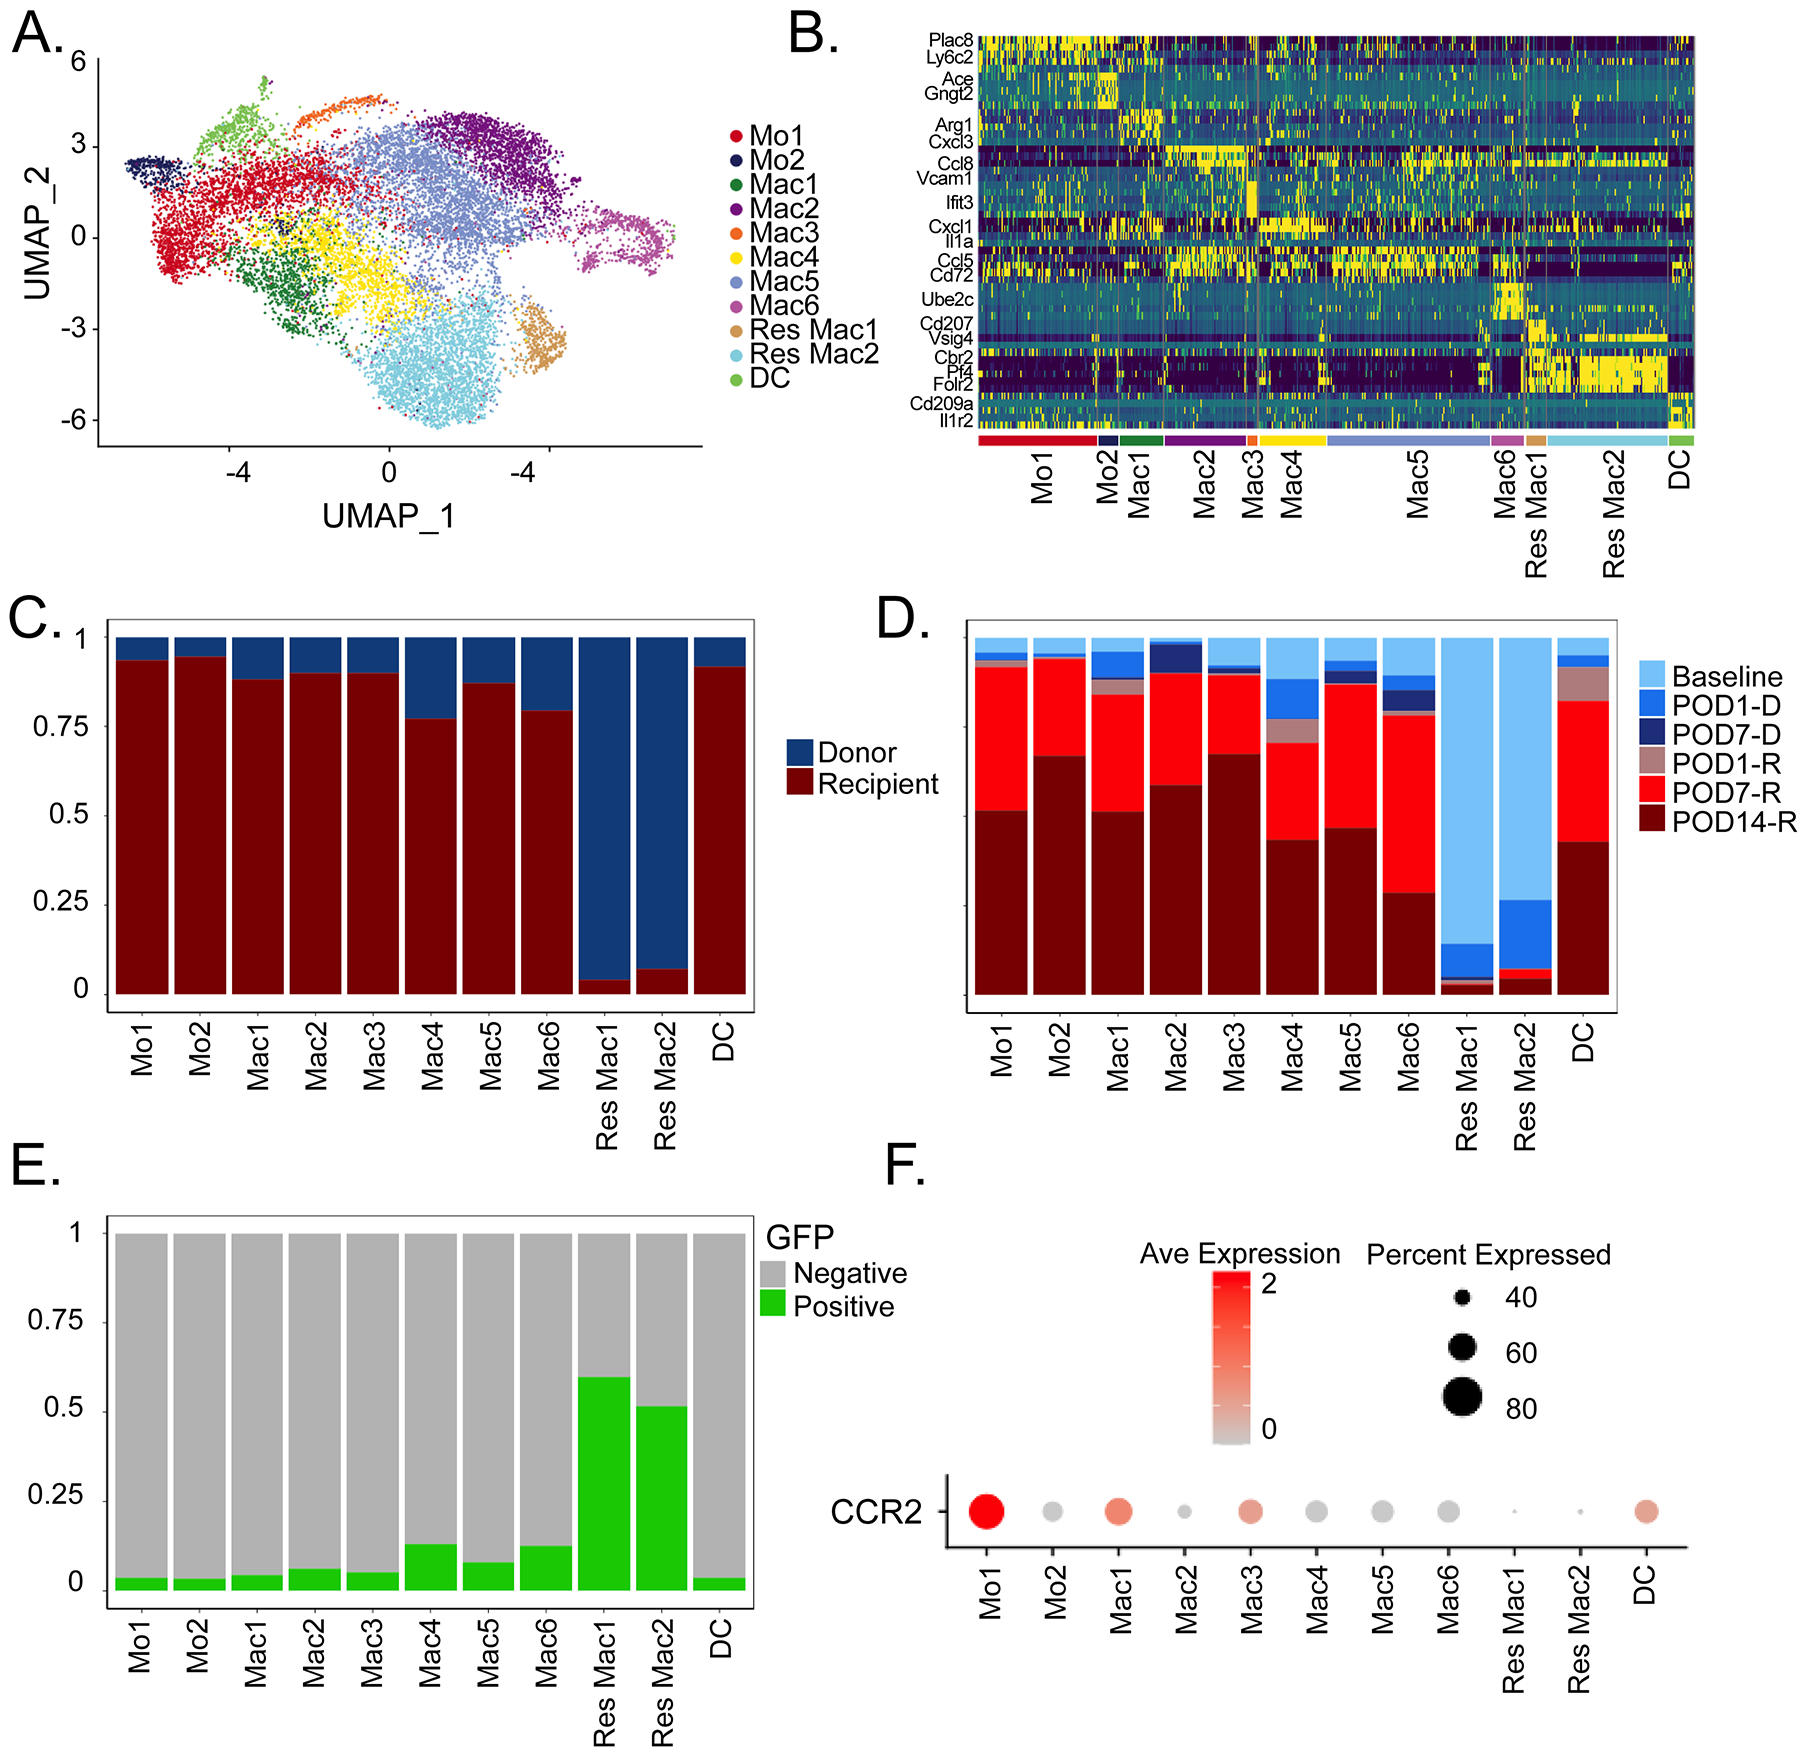
Figure 3: Macrophage diversity in integrated recipient and donor hearts post heart transplantation.

A) UMAP embedding plot of Harmony integrated donor and recipient libraries colored by transcriptionally distinct cell states. B) Heatmap of top 5 differentially expressed genes across populations using statistically significant genes (adjusted p-value < 0.05, Bonferroni correction), with representative genes shown. C) Relative donor and recipient contribution to cell states in (A). D) Cell composition of donor/recipient cells at different time points among the different myeloid cell states. E) Percent GFP positive cells in myeloid cell states from (A). (F) DotPlot of CCR2 expression in different cell states.
