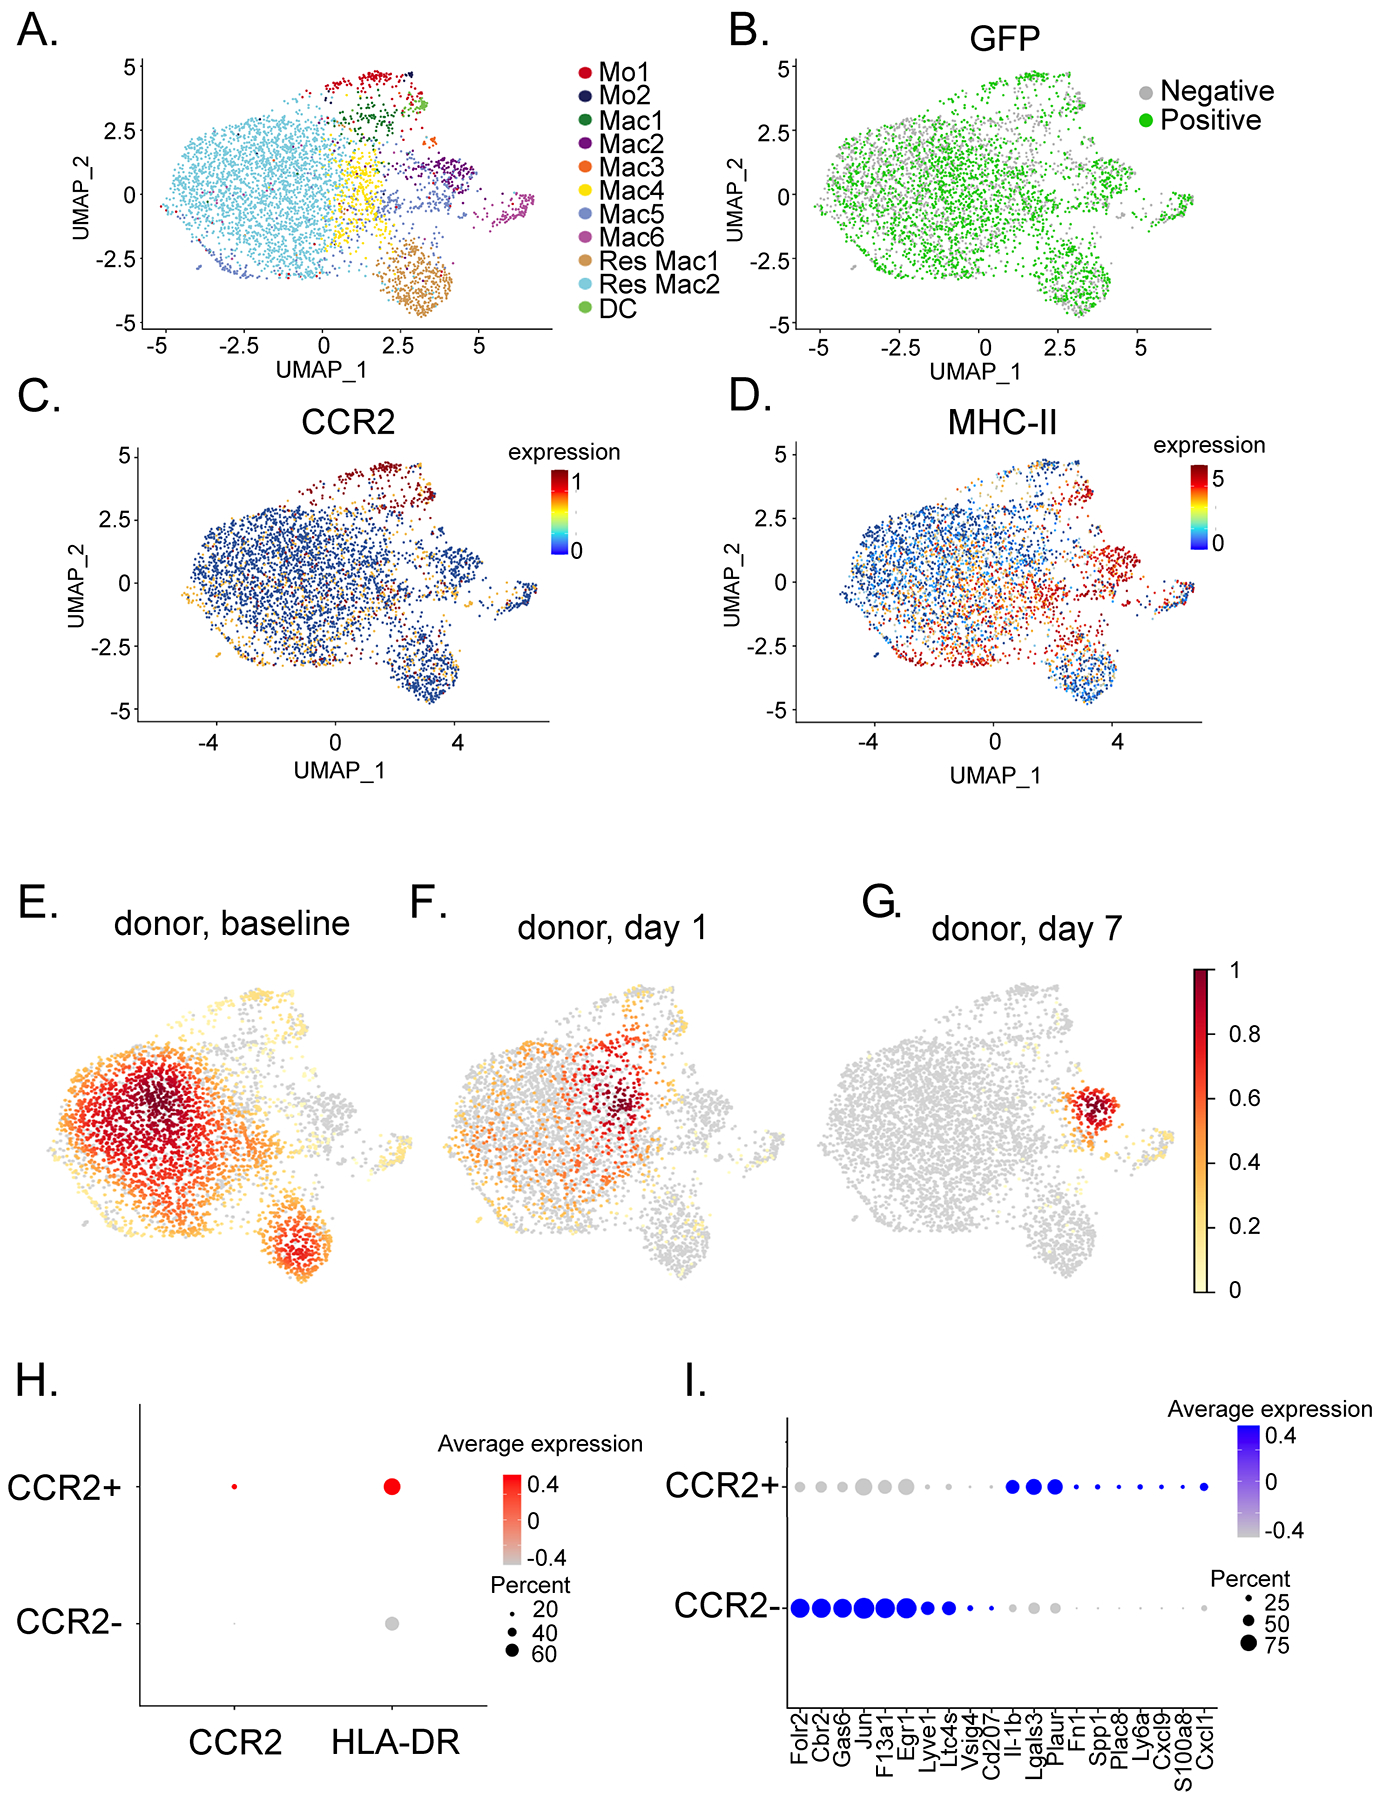
Figure 4: Donor macrophages change their transcriptional state and are diminished post-transplantation.

UMAP embedding plot of A) donor macrophages annotated by integrated object annotation B) GFP (51.7% positive) positive cells, C) Ccr2 and D) H2-Aa expression in donor myeloid cells. Gaussian kernel density embedding plots showing density of E) baseline, F) post-transplant day 1, and G) post-transplant day 7 donor myeloid cells in the UMAP space. H) DotPlot of CCR2 and HLA-DR expression in CCR2− (Res Mac1, Res Mac2, Mac2) and CCR2+ (Mo1, Mo2, Mac1, Mac3-6, DC) populations. I) Top differentially expressed genes between donor CCR2+ and CCR2− macrophages using statistically significant genes (adjusted p-value < 0.05, Bonferroni correction).
