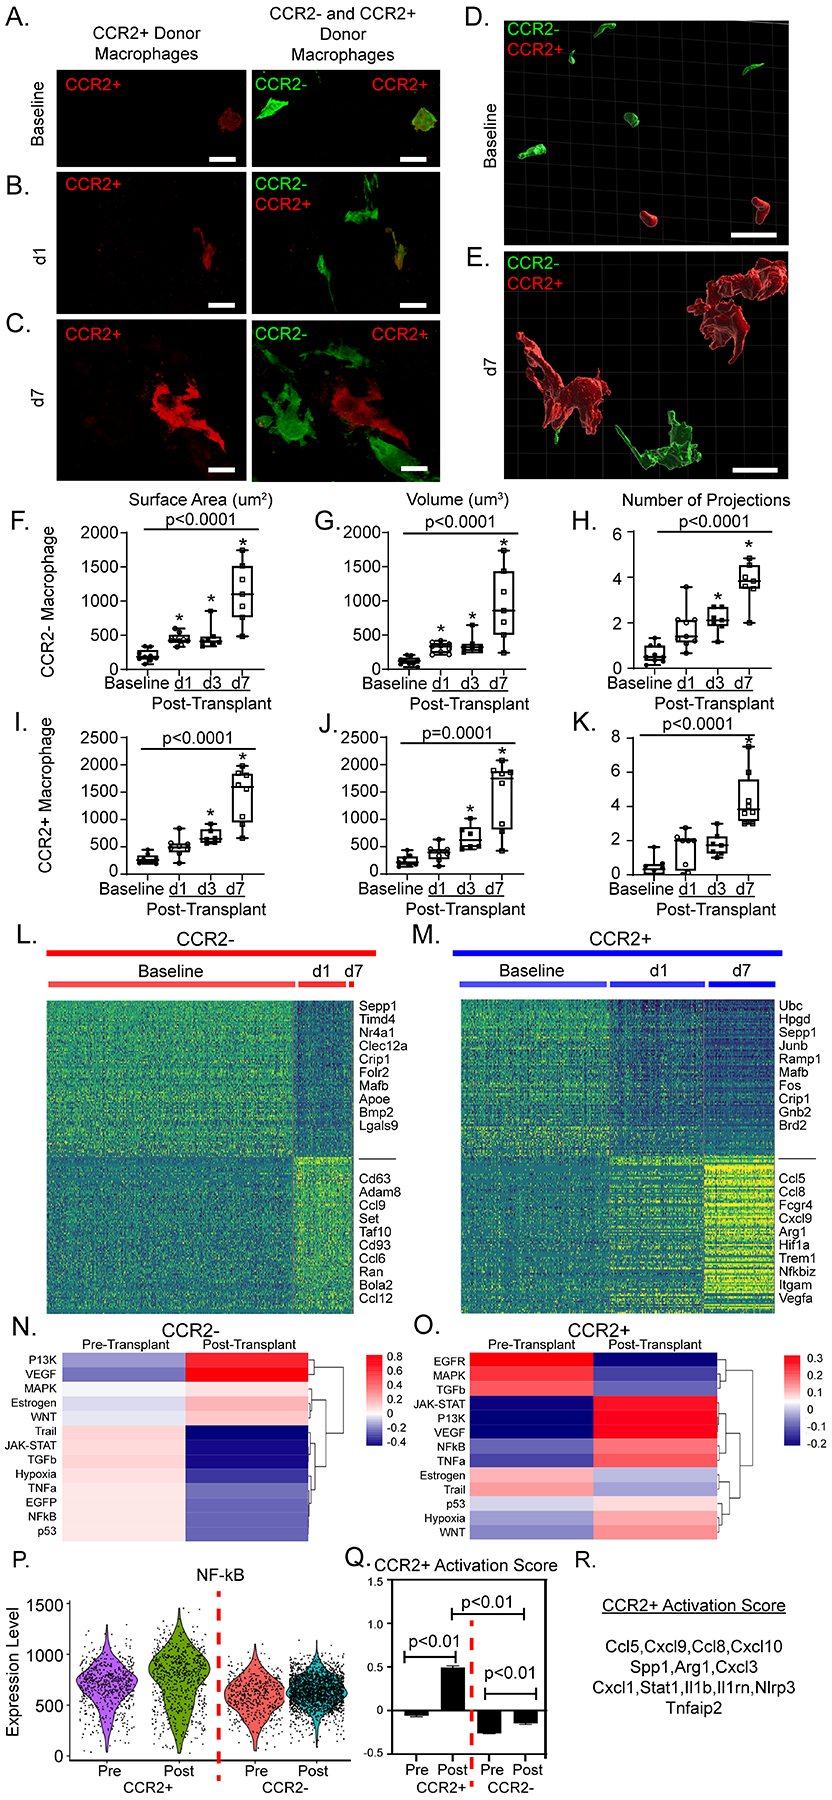
Figure 6: Donor macrophages dynamically respond after heart transplantation.

40X magnification z-stacks were obtained of dual reporter mice at A) baseline, B) post-transplant day 1 (d1), and C) post-transplant day 7 (d7). 30 μm thick sections were reconstructed with Imaris software to obtain volumetric reconstructions of donor macrophages at D) baseline and E) at d7. From reconstructions, quantitative measurements of donor CCR2− macrophages F) surface area (μm2), G) volume (μm3) and H) number of projections were obtained. For each timepoint, each data point represents the average of 10–20 macrophages from at least two regions of interest in at least two separate sections per heart. Identical measurements were performed in donor CCR2+ macrophages (I-K) across time. Statistical analyses were computed with Kruskal-Wallis (noted p-value) and Dunn’s test for multiple comparisons (* when < 0.05 compared to baseline) (baseline n = 10, d1 = 9, d3 = 7, d7 = 8). Heatmaps of normalized counts for differentially expressed marker genes between baseline and post-transplant for L) donor CCR2− macrophages and M) donor CCR2+ macrophages. PROGENy pathway analysis at basleine and post-transplant in N) CCR2− and O) CCR2+ macrophages. P) PROGENy derived NF-қB pathway enrichment score violin plot across 4 CCR2− and CCR2+ macrophages at baseline and post-transplant. Q) Gene set score for CCR2+ macrophage activation post-transplant shown in CCR2+ and CCR2− macrophages pre- and post-transplant (p < 0.01). Gene set score p-values calculated with 2-way ANOVA with multiple comparisons. R) Genes used to calculate gene set score. Scale bar = 10 μm.
