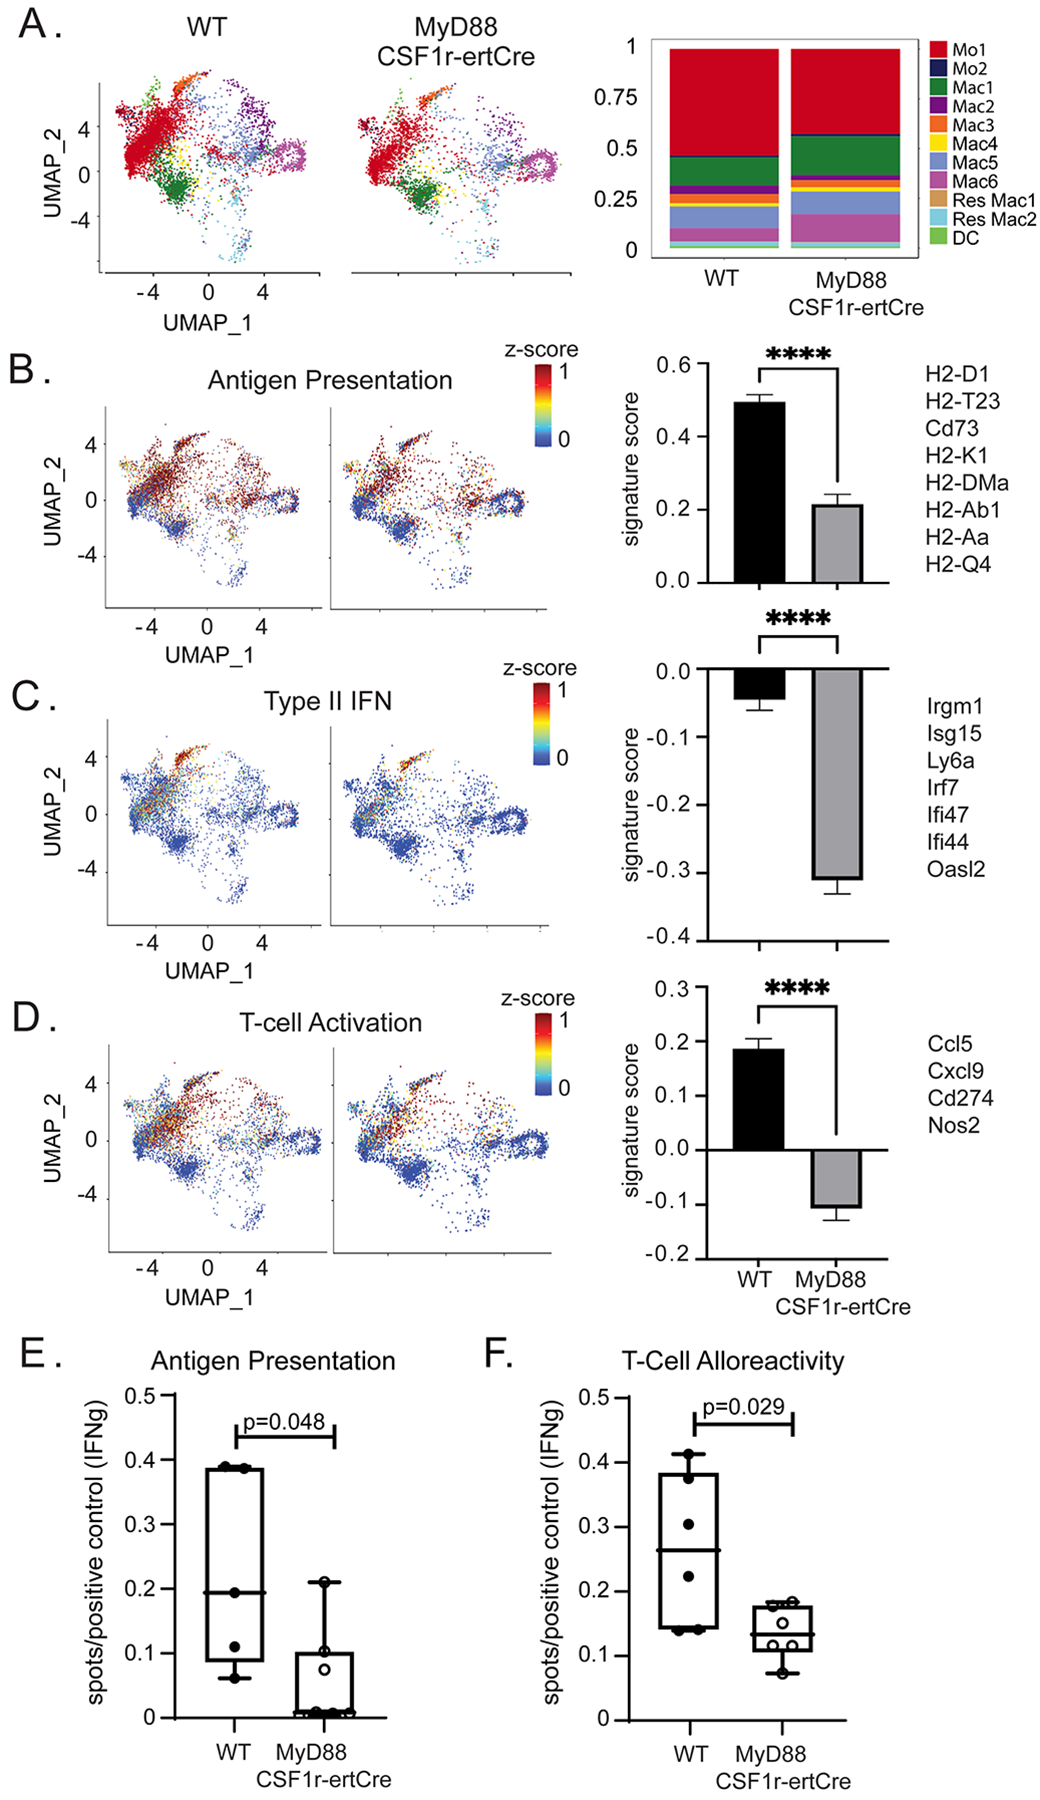
Figure 8: Donor MyD88 depletion leads to modulation of recipient immune cell gene expression.

UMAP embedding plot of A) post-transplant day 3 WT and post-transplant day 3 MyD88f/f CSF1rertCre/+ mapped onto integrated donor/recipient UMAP (left). Composition plot showing frequency of each population (right) in WT and MyDf/f CSF1rertCre/+. Combined z-scores for top genes and calculated gene set scores for B) antigen presentation (0.569 vs 0.211, p<0.0001), C) interferon signaling (−0.0032 vs −0.324, p<0.0001), and D) T-cell activation (0.1744 vs −0.1803 p< 0.0001) gene set scores with genes on the right. Statistical test Mann-Whitney U Test. E) Number of IFN-γ spots per conA positive control of DO.11 T-cells co-cultured with OVA-loaded post-transplant days 3–4 macrophages and monocytes (Antigen presentation assay) with a significant reduction in MyD88f/f CSF1rertCre/+ cohort (0.0084 vs 0.19 spots/conA treated T-cell control; Mann-Whitney U Test; p = 0.048; n = 5 WT, n = 6 MyD88f/f CSF1rertCre/+). F) Number of IFN-γ spots per conA positive control of recipient T-cells co-cultured with irradiated donor antigen (T-cell alloreactivity assay) with a significant reduction in MyD88f/f CSF1rertCre/+ cohort (0.13 vs 0.26 spots/conA treated T-cell control; Mann-Whitney U Test; p = 0.029; n = 6 each group).
