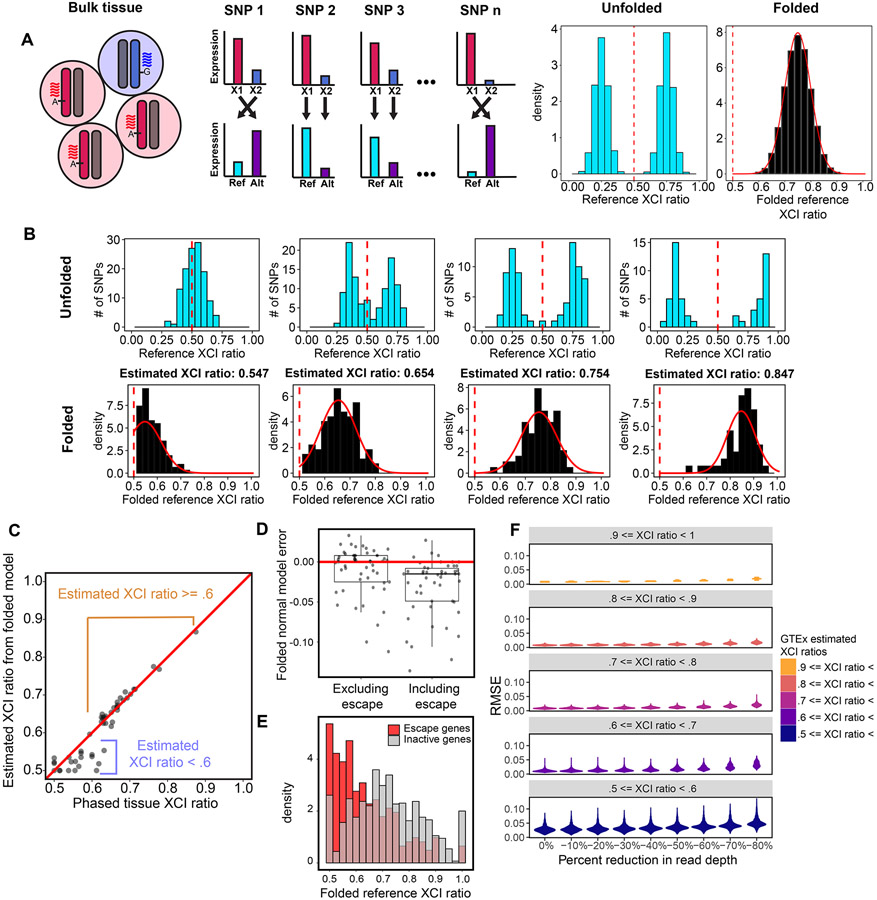
Figure 2: The folded-normal model accurately estimates XCI ratios from unphased bulk RNA-sequencing data.
A, Schematic demonstrating how allelic expression of heterozygous SNPs reflect the XCI ratio of bulk tissue samples. Aligning expression data to a reference genome scrambles the parental haplotypes. Folding the reference allelic expression ratios captures the magnitude of the tissue XCI ratio. B, Distributions of reference allelic expression ratios for identified heterozygous SNPs across tissue samples exhibiting a range of bulk XCI ratios. Both the unfolded (top row) and folded distributions with the fitted folded normal model (bottom row) are shown. C, For the EN-TEx tissue samples, the phased median gene XCI ratio is plotted against the unphased XCI ratio estimate from the folded normal model. The folded normal model produces near identical XCI ratio estimates for samples with XCI ratios greater than or equal to 0.60. D, Deviation of the folded normal model from the phased median gene XCI ratio when excluding or including known escape genes. E, Aggregated folded reference allelic expression distributions for known escape and inactive genes in EN-TEx tissues with XCI ratios >= 0.70. F, Root mean squared error distributions for GTEx tissue samples binned by their original estimated XCI ratio as read depth per SNP is gradually reduced. See also Figure S1.

