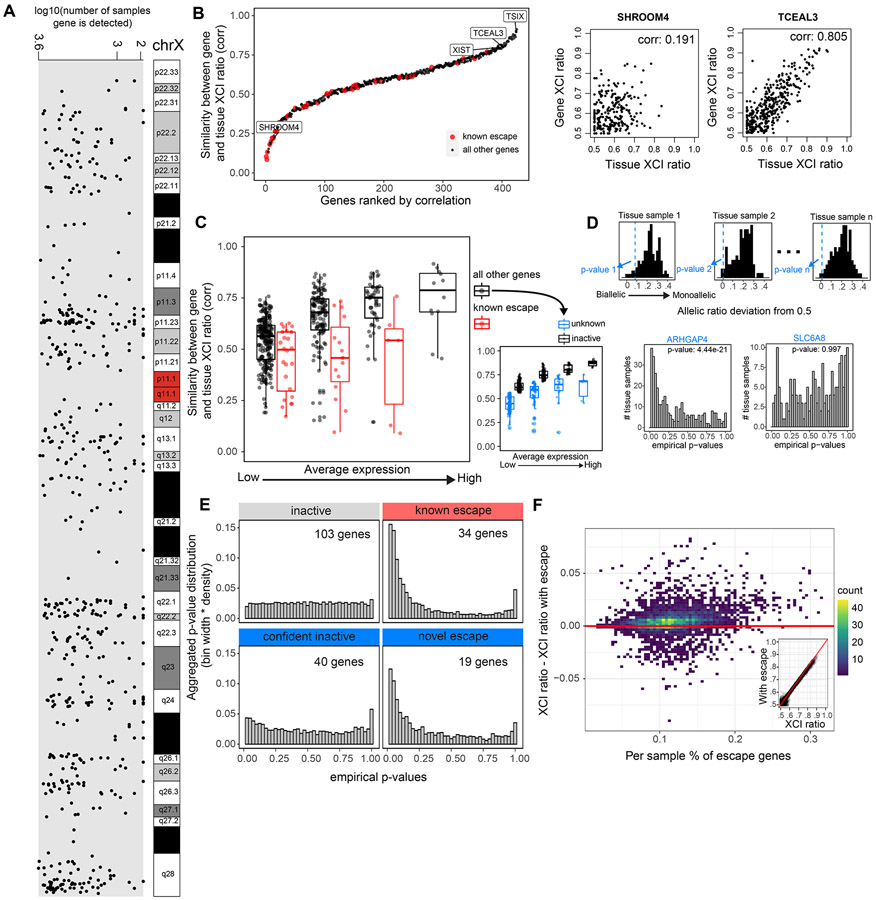
Figure 3: Genes that escape XCI exhibit balanced biallelic expression across XCI skewed tissues.
A, The genomic location and number of GTEx samples each gene is detected for the 542 genes that pass our quality control filters. B, All 542 genes and 45 known escape genes ranked by the Pearson correlation coefficient for each gene’s allelic expression and the XCI ratio of the tissue for samples that detect that gene. C, Distributions of gene-tissue XCI ratio correlations for all 542 genes and 45 escape genes, binned by average expression. The range of average expression is binned into 4 equally spaced bins. We label the top 50% of ‘all other genes’ in each expression bin as ‘inactive genes’ and the bottom 50% as ‘unknown’ genes, as they are potentially a mix of inactive and unannotated escape genes. D, An example for how the empirical p-values are calculated for a given test gene across tissue samples. For a given tissue sample, we calculate each gene’s allelic expression ratio deviation from 0.5, where the black histogram represents the deviations from the inactive genes in the sample and the blue dotted line represents the deviation of the given test gene in the sample, ARHGAP4 in this example. We apply Fisher’s method to aggregate each test gene’s distribution of empirical p-values to calculate a meta-analytic p-value to determine significance (ARHGAP4 meta-analytic p-value: 4.44e−21, SLC6A8 meta analytic p-value: 0.997). E, The aggregated empirical p-value distributions for inactive, known escape, and the unknown genes now classified as confident inactive and novel escape are plotted. The unknown genes are classified as either confident inactive or novel escape by using a significance threshold of meta-analytic p-value < .001. F, The percent of genes previously annotated for escape per sample is plotted against the difference between the sample’s XCI ratio estimates derived when either including or excluding the previously annotated escape genes. The inset plot compares the XCI ratio estimates derived without the known escape genes (x-axis) or including the known escape genes (y-axis). See also Figure S2 and Table S1.

