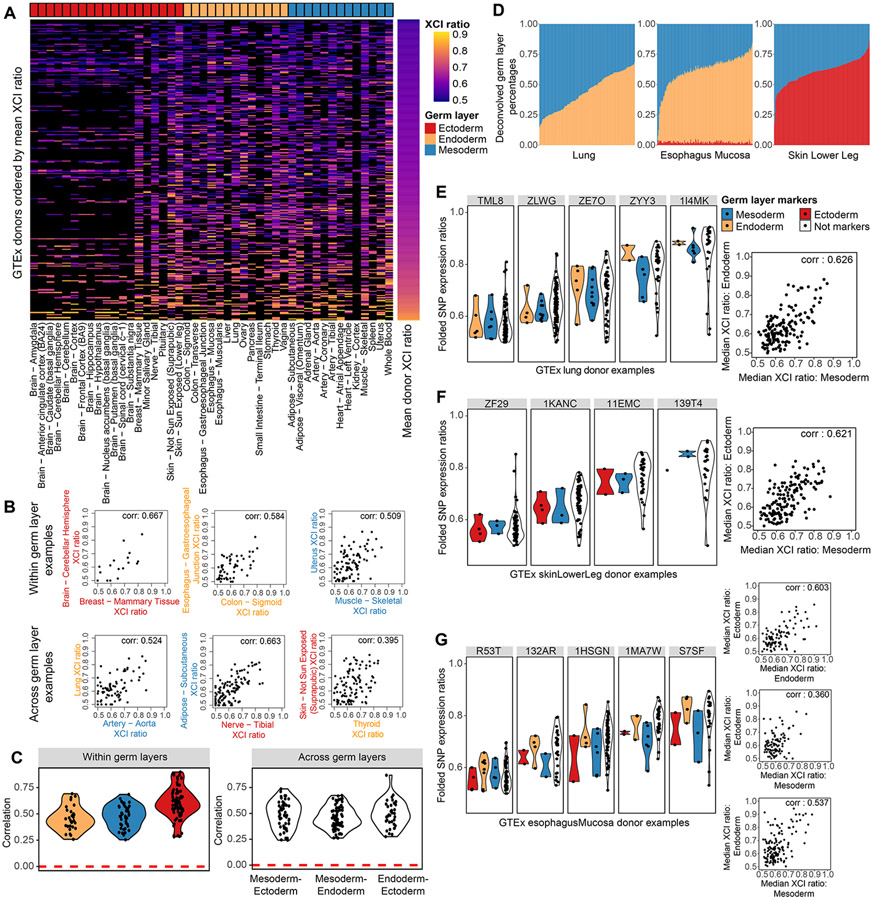
Figure 4: XCI ratios are shared across germ layer lineages.
A, Heatmap of all estimated XCI ratios for the tissues of each donor, with donors ordered by their mean XCI ratio across tissues and tissues grouped by germ layer lineage. Black indicates no tissue donation for that donor-tissue pair. B, Examples of within and across germ layer lineage comparisons of XCI ratios. Each data point represents the estimated XCI ratios of the two indicated tissues for a single donor. C, All significant (FDR corrected p-value <= 0.5, permutation test n = 10000) Pearson correlation coefficients for within and across germ layer lineage comparisons. D, Stacked bar plots for the germ layer percentage composition for each sample in the Lung, Esophagus Mucosa, and Skin Lower Leg GTEx tissues. The deconvolved cell type percentages and their germ layer annotations are provided in Fig. S2. E-G, the folded allelic expression ratios for germ layer markers and all other genes (Not markers) are plotted for several example donors per tissue, E: Lung, F: Skin Lower Leg, G: Esophagus Mucosa. The adjacent scatter plots compare the median folded allelic expression between germ layer markers for all donors. E: Lung mesodermal and endodermal markers, Pearson correlation of 0.626 (p-value < .001), F: Skin Lower Leg mesodermal and ectodermal markers, Pearson correlation of 0.621 (p-value < .001), G: Esophagus Mucosa endodermal and ectodermal markers, Pearson correlation 0.603 (p-value < .001), mesodermal and ectodermal markers, Pearson correlation 0.360, (p-value < .001), mesodermal and endodermal markers Pearson correlation 0.537 (p-value < .001). See also Figure S3-4 and Table S2.

