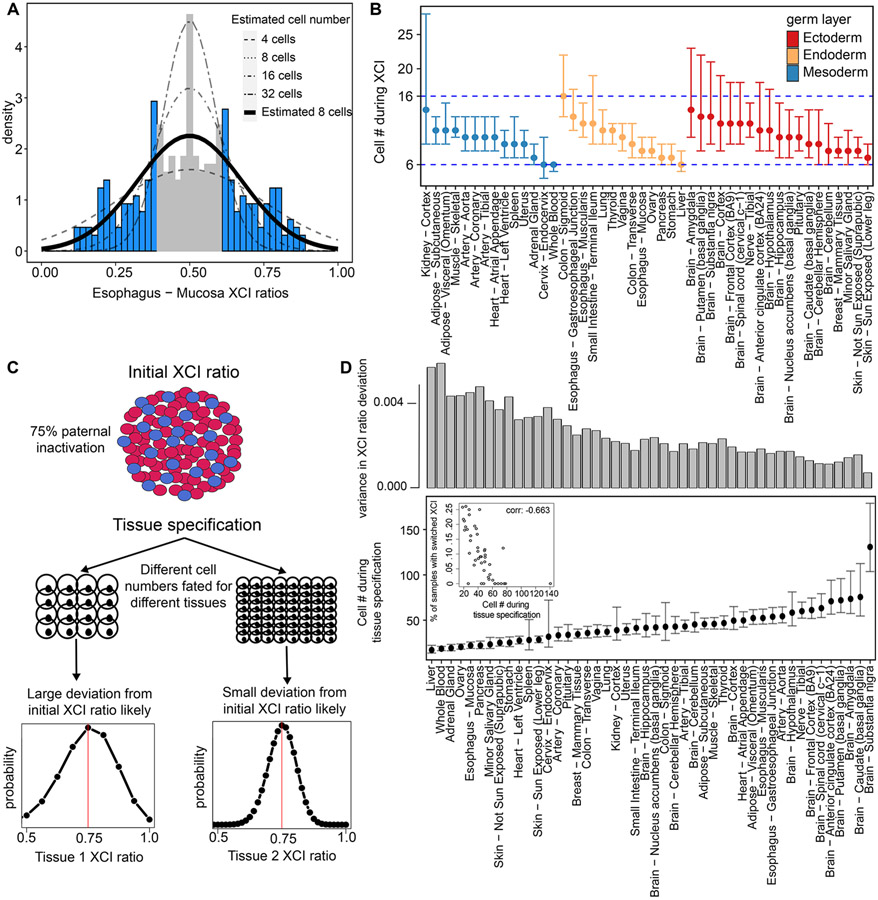
Figure 6: XCI and tissue lineage specification can be timed to a pool of cells by exploiting observed variability.
A, Example tissue demonstrating the model for estimating cell numbers at the time of XCI using the population-level variance in XCI ratios. We fit normal distributions, as a continuous approximation of the underlying binomial distribution of XCI ratios, to the tails of tissue-specific XCI ratio distributions (shaded in blue), which accounts for the uncertain 0.40-0.60 unfolded XCI ratio estimates (shaded in grey). B, The resulting estimated cell numbers present during XCI derived from the XCI ratio variance of all tissues with at least 10 donors. Error bars are 95% confidence intervals and tissues are grouped by germ layer lineage. C, Schematic for our model of tissue lineage specification and the implications for tissue-specific XCI ratios. The XCI ratio of a tissue is dependent on the prior XCI ratio of the embryo and the number of cells selected for that tissue lineage. These two features define the binomial distribution for that tissue’s XCI ratio. D, Estimated number of cells selected for individual tissue lineage specification of 46 different tissues. Error bars represent 95% confidence intervals. The top bar graph plots the variance in the distribution of tissue XCI ratio deviation from the average XCI ratio of each donor for that tissue. The inset plot compares the estimated number of cells present at the time of tissue specification to the proportion of that tissue’s samples that switched parental XCI directions, Pearson correlation −0.663 (p-value < .001).

