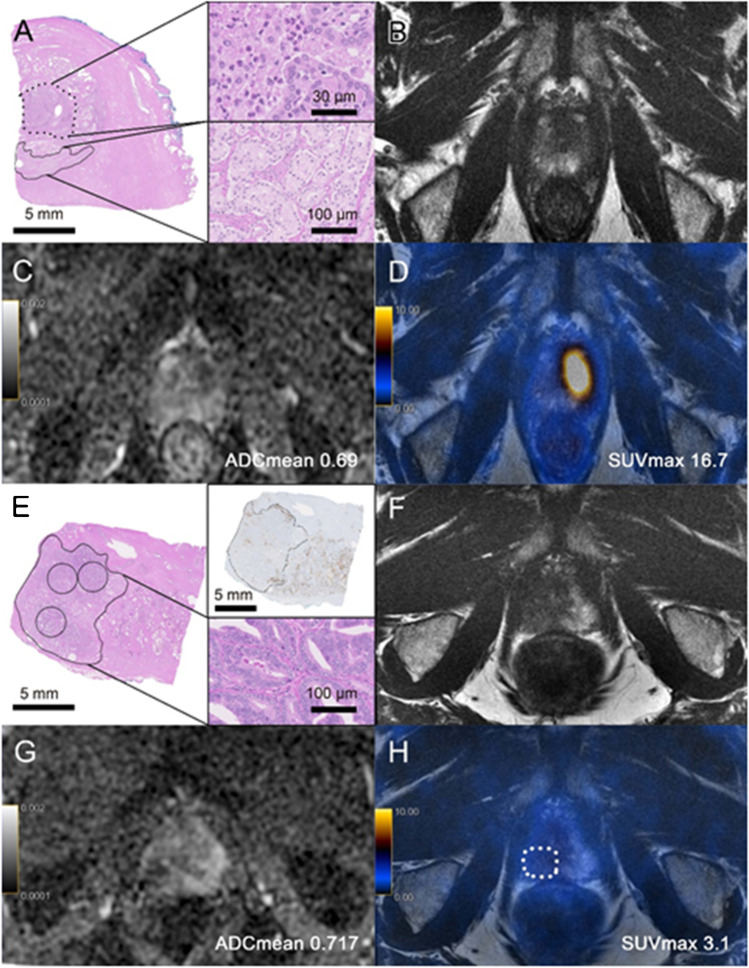
Fig. 6.
Two cases without correspondence between growth pattern and imaging parameters. A–D A 62-year-old patient with PSA of 12.7 ng/ml, GS = 4 + 3 (ISUP 3). A Histopathology slide showing an infiltrative growth pattern of the “dominant lesion’’ (continuous circle, detail on the right lower right side) on the anterior left part of the prostate apex with a maximum diameter of 8.3 mm; next to the carcinomatous lesion, acute inflammation (dotted circle, detail on the upper right side) can be found. B Corresponding axial T2-weighted MRI with a hypointense area. C On ADC map, the lesion had a low ADCmean of 0.69. D On axial [68Ga]PSMA PET/MRI, the lesion showed high PSMA-uptake (SUVmax = 16.7). In direct correlation of imaging and histopathology, the acute inflammation was probably responsible for the low ADC value and high PSMA uptake. E–H A 60-year-old patient with PSA of 1.3 ng/ml, GS = 4 + 3 (ISUP 3). E Histopathology slide showing an expansive growth pattern of the large “dominant lesion’’ on the posterior right part of the prostate apex with a maximum diameter of 17.3 mm. F Corresponding axial T2-weighted MRI with a hypointense area. G On ADC map, the lesion had a low ADCmean of 0.717. H On [68Ga]PSMA PET/MRI, the lesion showed low PSMA-uptake (SUVmax = 3.1)

