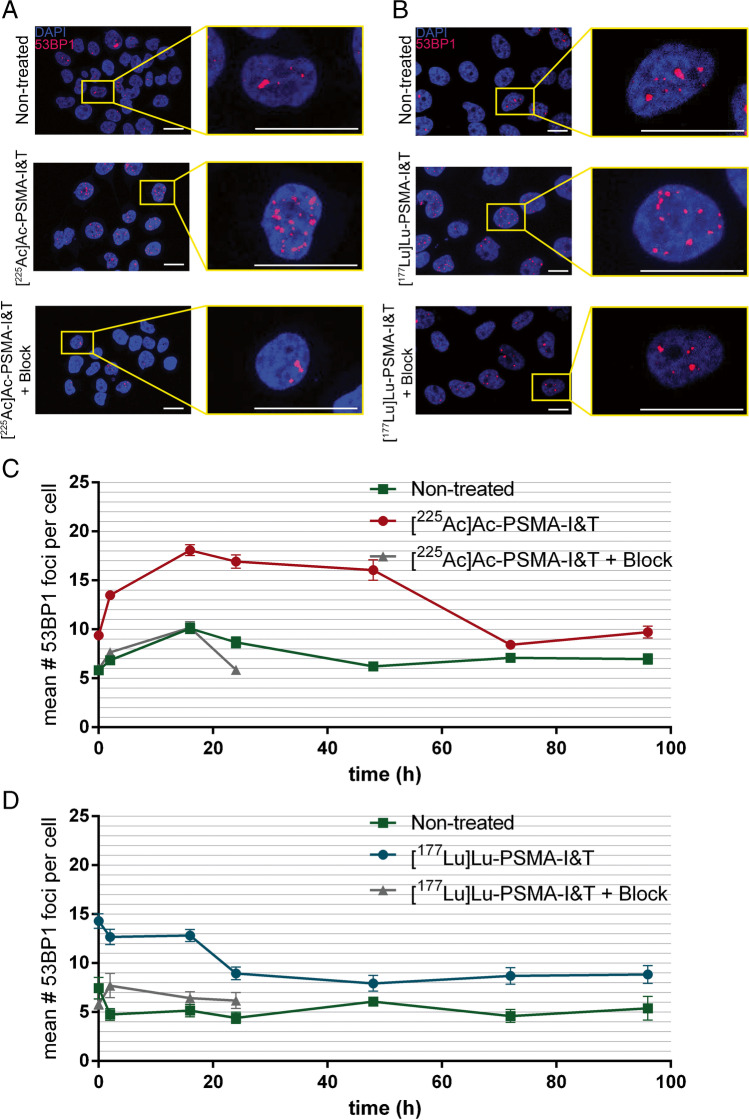
Fig. 2.
DSB analysis of cells treated with [225Ac]Ac-PSMA-I&T or [177Lu]Lu-PSMA-I&T based on 53BP1 foci quantification. A Representative images of cells 24 h after incubation with [225Ac]Ac-PSMA-I&T (0.37 kBq/mL with and without a block of ×1000 excess of unlabeled PSMA-I&T) and non-treated cells (scale bar = 10 μm). Blue: DAPI; red: 53BP1. B Representative images of PC3-PIP cells 24 h after incubation with [177Lu]Lu-PSMA-I&T (0.4 MBq/mL with and without block) and NT cells (scale bar = 10 μm). Blue: DAPI; red: 53BP1. C Representative graph of the average number of 53BP1 foci per nucleus of cells treated with 0.37 kBq/mL [225Ac]Ac-PSMA-I&T, non-treated cells, and cells treated with 0.37 kBq/mL [225Ac]Ac-PSMA-I&T with a block on different time points after incubation. D Representative graph of the average number of 53BP1 foci per nucleus of cells treated with 0.4 MBq/mL [177Lu]Lu-PSMA-I&T, non-treated cells, and cells treated with 0.4 MBq/mL [177Lu]Lu-PSMA-I&T with a block on different time points after incubation. Error bars indicate SEM. Experiment was performed twice; 1 representative graph for both conditions is presented here and the additional graphs can be found in the supplemental material (Figure S1)

