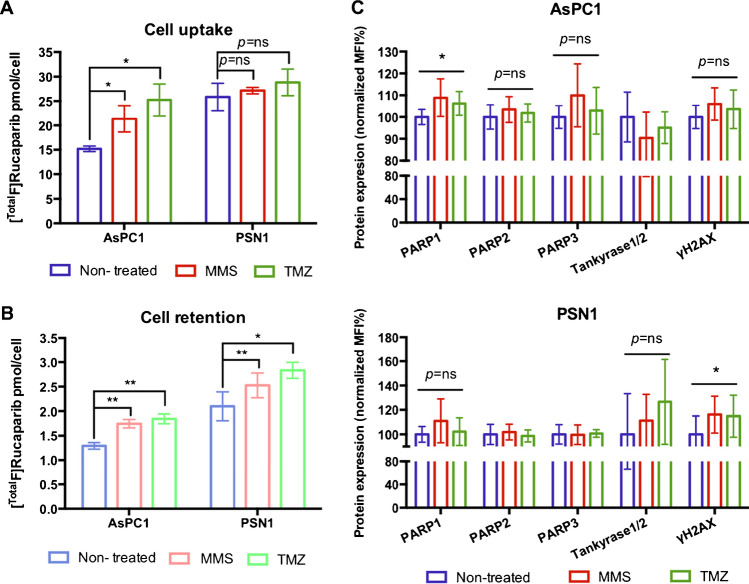
Fig. 2.
A Uptake and B retention (at 3 h) of [TotalF]rucaparib ([18F]rucaparib: 500 kBq, 3.6 GBq/μmol) in cells (AsPC1 and PSN1) treated with DNA-damaging reagents (MMS and TMZ). C Mean fluorescence intensity (MFI) for PARP1, 2 and 3, tankyrase1/2 and γ-H2AX expressions in AsPC1 and PSN1 cells after exposure of MMS or TMZ (100 μM) for 3 h, assessed by flow cytometry analysis. Asterisks indicate levels of significance: ns, P > 0.05; *, P < 0.05; **, P < 0.01

