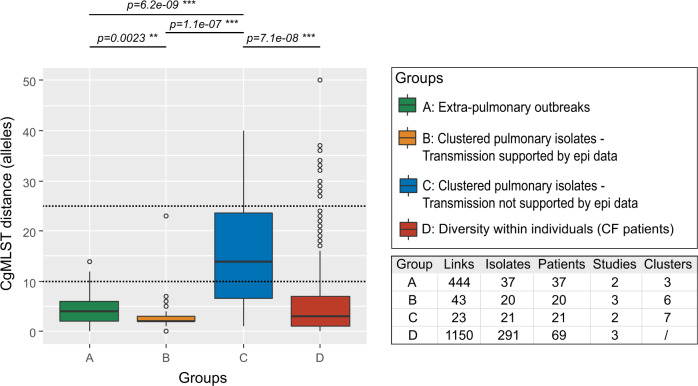
Fig. 3. Boxplots of pairwise genetic distances (i.e. cgMLST allele differences) between related isolates.
A Pairwise distances between isolates from previously reported extra-pulmonary Mab outbreaks21, 41 (n = 444 pairwise comparisons). B Pairwise distances between pulmonary isolates from cystic fibrosis (CF) patients for which epi data suggested nosocomial transmission12, 15, 43 (n = 43 pairwise comparisons). C Pairwise distances between pulmonary isolates from predominantly cystic fibrosis (CF) patients for which epi data did not support nosocomial transmission15, 42 (n = 23 pairwise comparisons). For B and C, clusters were previously defined with a threshold of 30 SNPs. D Pairwise distances between isolates from the same patient12, 15, 42 (n = 1,150 pairwise comparisons). All outliers are related to patient 512. Dashed lines indicate tentative thresholds to initiate further epidemiological investigations. Solid lines indicate median pairwise allele distance, box represent interquartile range (IQR), whiskers extend to 1.5 of the IQR, dots represent outliers. Links are the amount of pairwise comparisons included per group. Pairwise allele distances between groups were compared with a Wilcoxon rank sum test (with Bonferroni correction): *p < 0.05, **p < 0.01, ***p < 0.001.

