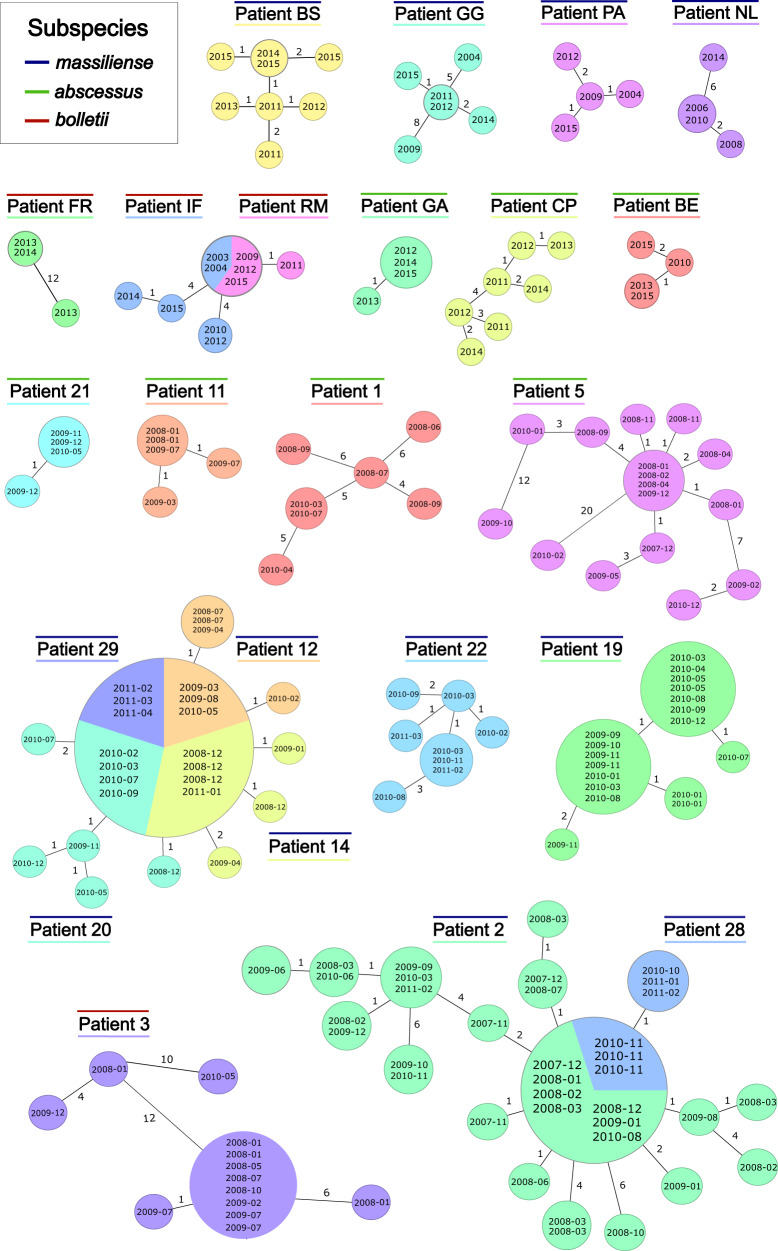
Fig. 4. CgMLST-based minimum spanning tree visualizing the genetic relationship between sequential isolates from the same patient (within-patient diversity).
Patients from two studies12, 15 with more than three isolates are displayed. Node labels correspond to the date of Mycobacterium abscessus isolate collection. The size of the nodes is proportional to the number of samples with identical cgMLST profile (i.e. with distance=0). Allelic distances between two isolates are displayed on the branches (not to scale).

