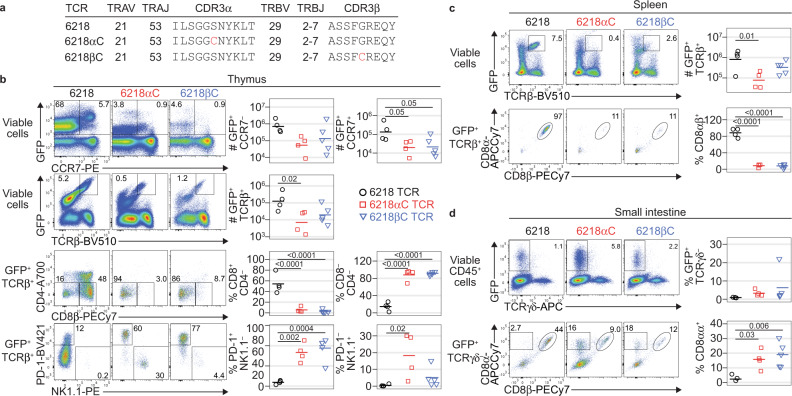
Fig. 1. T cell fate altered by a cysteine in CDR3.
a Details of the 6218, 6218αC and 6218βC TCRs. b Incorporation of Cys at the CDR3 apex alters T cell fate. BM cells pooled from Rag1–/– mice (7 female and 6 male; aged 37-134 d) were transduced with retroviruses encoding GFP and the 6218, 6218αC or 6218βC TCR and then mixed 1:1 with T cell-depleted BM cells from a male B6 mouse before injection into irradiated Rag1–/– mice (3 female and 1 male for 6218; 4 female for 6218αC and 5 male for 6218βC). The resulting TCR-retrogenic mice were analysed 5 weeks after BM transfer at 90-171 days of age. Plots show the GFP/CCR7 (row 1) and GFP/TCRβ (row 2) FACS phenotypes of live thymocytes, with a gate for GFP+ TCRβ+ thymocytes that were analysed for CD4/CD8β (row 3) and PD-1/NK1.1 (row 4). c GFP/TCRβ phenotype of splenocytes (top row) with a gate for the GFP+ TCRβ+ subset, which was analysed for CD8α/CD8β phenotype (bottom row). d GFP/TCRγδ phenotype of small intestinal CD45+ cells with a gate for the GFP+ TCRγδ– subset that was analysed for CD8α/CD8β phenotype (bottom row). In b, c, and d, graphs show the absolute number (#) of gated events, determined by multiplying the percentage of gated events by the total number of cells per organ, or the percentage of gated events, as denoted on the y-axes. See Supplementary Figs. 1, 2 for gating strategies and additional data. Each symbol in a graph represents one mouse; black for 6218, red for 6218αC and blue for 6218βC. P values were determined using 1-way ANOVA with Tukey’s multiple comparisons test. Source data are provided as a Source Data file.

