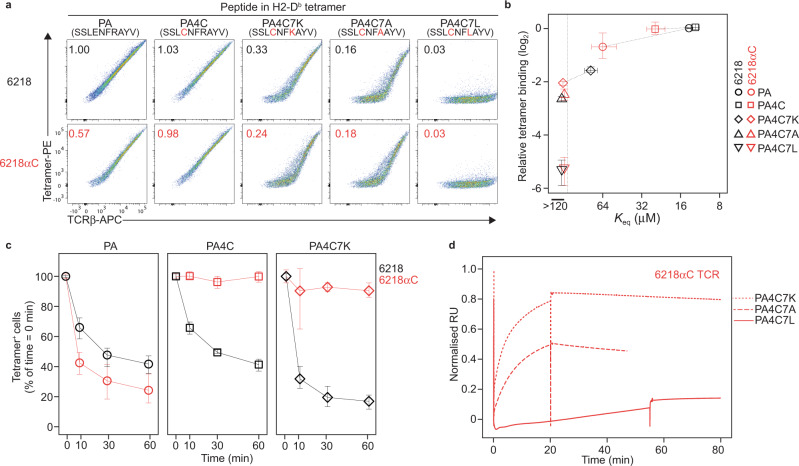
Fig. 7. S-S bonding across a wide range of TCR affinities for pMHC.
a Substitutions at P7 of the PA4C peptide decrease TCR binding by pMHC tetramers. Plots show FACS phenotypes of TCR transfectants expressing the 6218 or 6218αC TCR stained with anti-TCRβ and tetramers of H2-Db presenting the indicated peptide (top). Numbers on plots show the tetramer mean fluorescence intensity (MFI) divided by TCRβ MFI, normalized to the 6218 TCR-PA/H2-Db sample. b For the indicated TCR-peptide/H2-Db combinations (right), symbols show the mean tetramer binding, calculated as in a, as a function of the Keq determined by SPR (see Supplementary Fig. 8c), with dotted lines connecting measurements from the same pMHC. Error bars show the range of 3-6 samples from 2-3 experiments (y-axis) or the standard error of the mean of 2 experiments with a total of 4 samples per combination (x-axis). c S-S bond formation inhibits tetramer dissociation. TCR transfectants expressing 6218 or 6218αC and stained with pMHC tetramers as in a were washed and resuspended in buffer containing 25 μg/mL anti-H2-Db/Kb to prevent tetramer rebinding for 10 min, 30 min or 60 min before FACS analysis. Graphs show the tetramer+ cell frequency as a percentage of the corresponding sample without anti-H2-Db/Kb (time = 0 min). Symbols show the mean, and error bars the range, of 4 samples per condition compiled from 2 experiments. d Persistent interactions between P4-Cys-containing pMHC monomers and the 6218αC TCR. SPR sensorgrams show binding to the 6218αC TCR during and after 20-min injections of PA4C7K/H2-Db (dotted line) or PA4C7A/H2-Db (dashed line), or a 50-min injection of PA4C7L/H2-Db (solid line), all at 100 μM. Source data are provided as a Source Data file.

