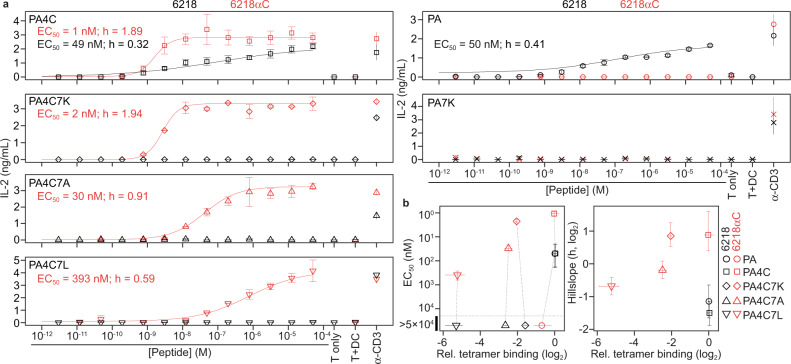
Fig. 8. T cell activation due to TCR-peptide S-S bonding.
a Supernatant IL-2 concentration after coculture of 5KC T cells expressing 6218 or 6218αC and DC2.4 cells with graded concentrations of the peptide denoted in the upper left of each graph. Control cultures included 5KC cells with 50 μM peptide (T only), 5KC and DC2.4 cells without peptide (T + DC), and 5KC cells with plate-bound anti-CD3 (α-CD3). Symbols show the mean, and error bars the range, of 2 wells per condition from one experiment, representative of at least 2 experiments. HillSlope (h) values were determined using nonlinear regression. For curves that did not reach a plateau, the reported EC50 values provide a minimum estimate of the EC50. b For each TCR/peptide combination, graphs show relative tetramer binding (x-axes, plotted as in Fig. 7b) against EC50 (left) or h (right) values, which were determined from a total of at least 4 dilution series per peptide analyzed in at least 2 experiments. Error bars indicate the 95% confidence intervals of EC50 and h; dotted lines connect measurements from the same pMHC. Source data are provided as a Source Data file.

