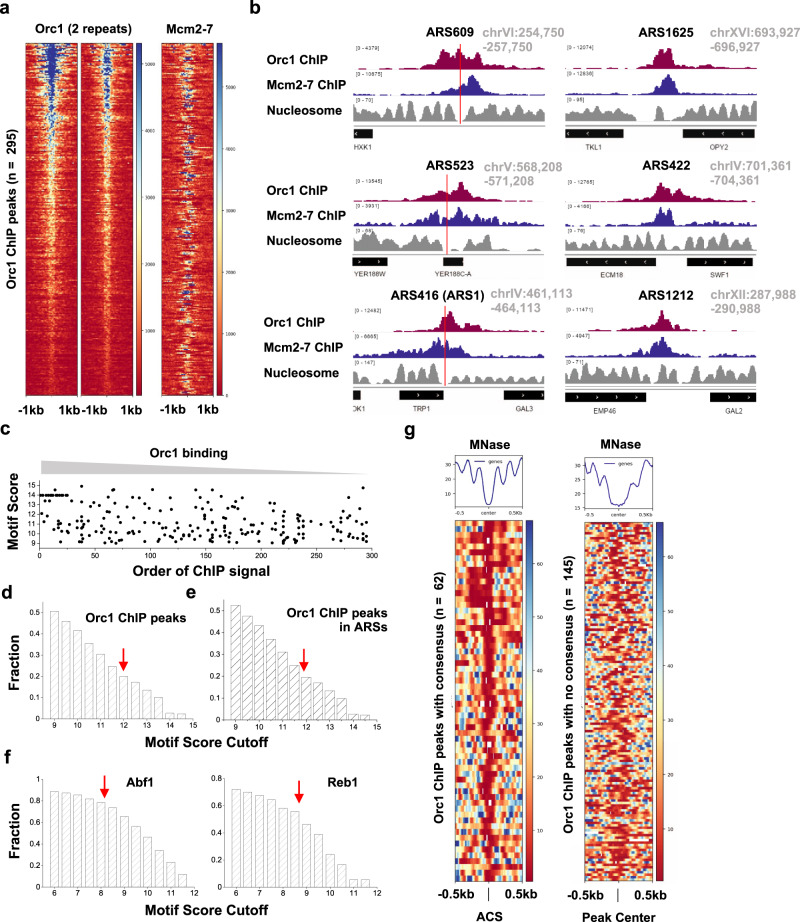
Fig. 7. Genome-wide analysis of ORC/MCM localization and ACS motif scores.
a Heatmap of Orc1 ChIP peaks (n = 295) and Mcm2-7 ChIP signal at the corresponding sites. b Examples of Orc1 and Mcm2-7 ChIP data and nucleosome occupancy at six ARS. Red vertical lines represent the location of ACS consensus in these regions. The three ARS on the right contain no consensus with score above 9. c ACS motif score vs. Orc1 ChIP peak strength. The motifs were identified in a 1-kb region near Orc1 ChIP peaks (peak center ±500 bp). All elements with a PWM score >9 are shown here. For the x axis, “1” represents the largest Orc1 ChIP peak, and “295” the weakest. d Fraction of sequences underlying all Orc1 peaks that contain motifs above a certain threshold (varying from 9 to 15). The red arrow represents the recommended cutoff of 11.9. e Same as in d except using a subset of Orc1 peaks that overlap with previously annotated ARS. f Abf1 and Reb1 ChIP peaks analyzed in the same way as in d. The red arrows represent recommended cutoffs for these two factors. g Heatmap of nucleosome occupancy near Orc1 ChIP peaks. The left panel includes 62 peaks containing ACS consensus (PWM > 11.9), with each row aligned at the consensus site. The right panel includes 145 peaks with no consensus above 9, and it was aligned at the center of the ChIP peaks.

