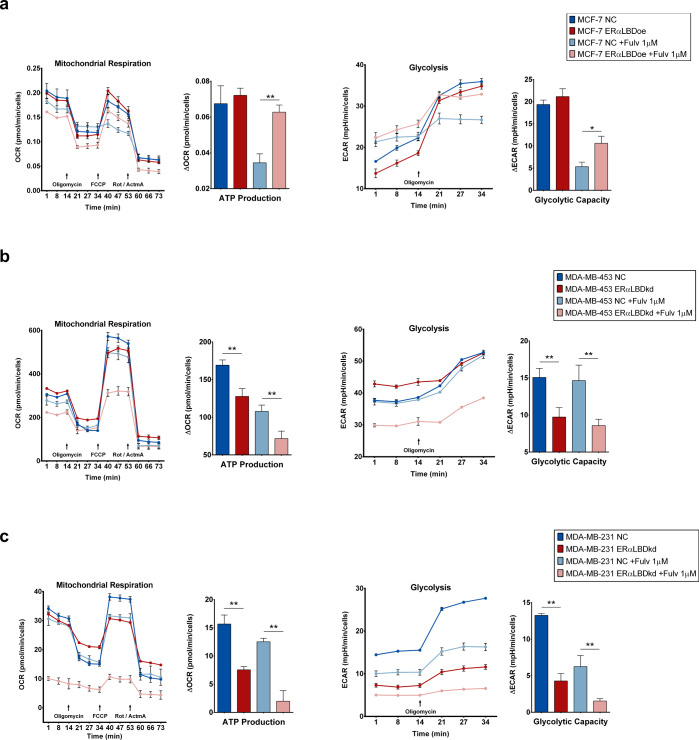
Fig. 5. Effect of ERα-LBD ‘gain/loss-of-function’ on BC cell metabolism.
a Mitochondrial respiration and glycolysis levels in MCF-7 cell clones. Fulvestrant 1 µM (24 h pre-treatment) or vehicle (DMSO) was added to cells. ERα-LBD overexpressing (ERα-LBDoe; in dark/light red) cells were compared to controls (NC; in dark/light blue). Analyses were carried out using XF Cell Mito Stress Kit (Agilent). Respiration was evaluated as oxygen consumption rate (OCR, pmol/min), normalized on cell number. Glycolysis was evaluated as extracellular acidification rate (ECAR, mpH/min), normalized on cell number. The calculation of metabolic parameters was based on ΔOCR and ΔECAR values, following manufacturer’s guidelines. b, c Mitochondrial respiration and glycolysis levels in MDA-MB-453 and MDA-MB-231 cells. Treatments as in (a). Cells with ERα-LBD knockdown (kd; in dark/light red) were compared to controls (NC; in dark/light blue). Analyses were carried out as described above. FCCP p-trifluoromethoxy-phenylhydrazone, Rot rotenone, AtmA antimycin A. Data in the figures are presented as mean ± s.e.m. (n = 2 independent experiments). *P < 0.05, **P < 0.01; unpaired t test, one-sided. Source data are provided as a Source Data file.

