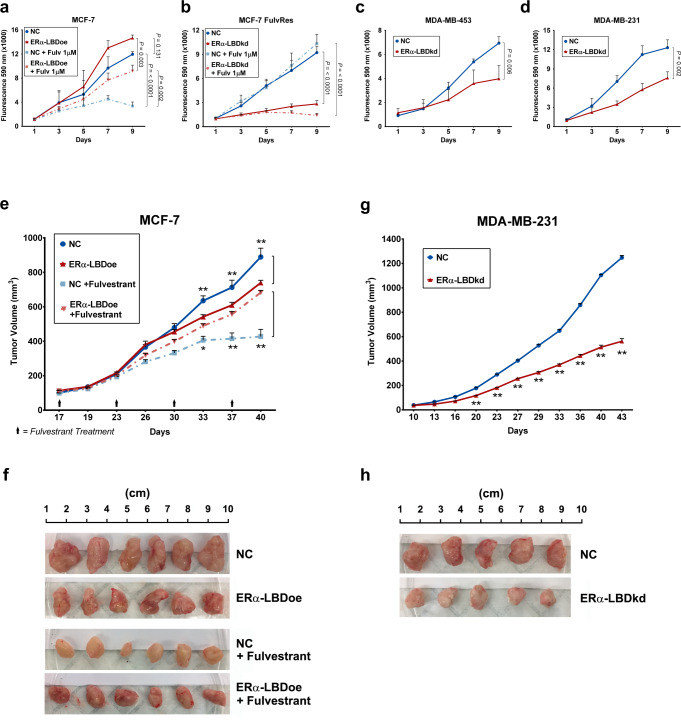
Fig. 6. ERα-LBD promotes in vitro and in vivo growth and fulvestrant resistance.
a–d In vitro proliferation of BC cell clones, using resazurin reagent and expressed as fluorescence intensity (absorbance at 590 nm). ERα-LBD overexpression (a) or knockdown (b–d) was compared to controls (NC). In a and b, cell proliferation was also tested in the presence or absence of fulvestrant 1 µM treatment (n = 3 independent experiments). All P values describing statistical differences between samples are shown. e–h Xenografts of BC cells implanted into the mammary fat pads of NOD scid gamma (NSG) mice. Plots in e and f show mean tumor volumes (mm3) as a function of time (days). MCF-7 model: when tumors reached 100 mm3, mice were randomized (n = 6/group) to weekly treatments with 200 mg/kg fulvestrant injected intramuscularly, and compared to control groups (n = 6/group). MDA-MB-231 model: n = 5/group. f–h Images and size of tumors, isolated from animals after reaching endpoint. In a and e, NC is in blue and ERα-LBD overexpression in red. In b–d and g, NC is in blue and ERα-LBD knockdown in red. All data in the figure are presented as mean ± s.e.m., ns not significant, *P < 0.05, **P < 0.01, two-way ANOVA. Source data are provided as a Source Data file.

