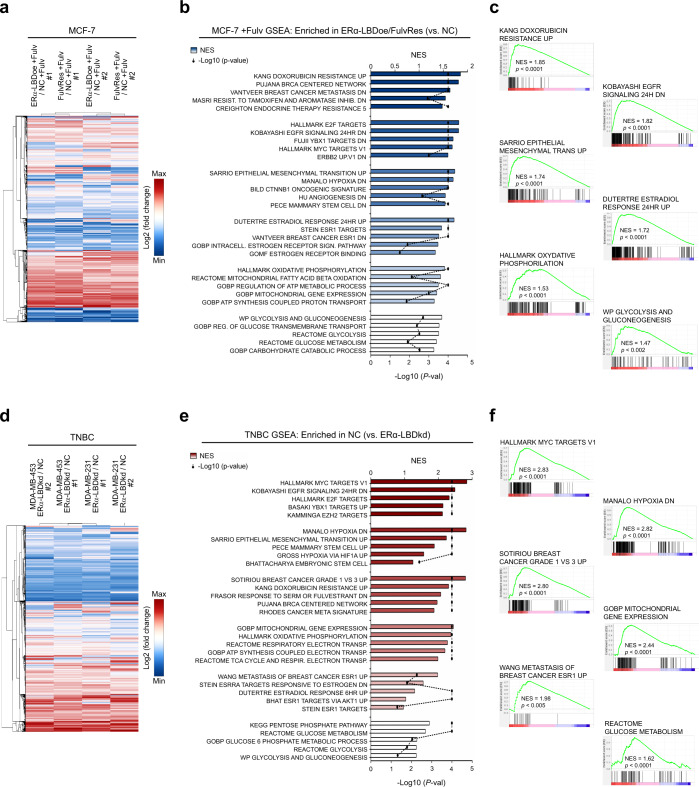
Fig. 7. ERα-LBD expression is associated with proliferation, endocrine resistance, stemness, and metabolism of breast cancer cells.
Two different BC cell models were used to investigate cell phenotypes associated with ERα-LBD ‘gain/loss-of-function’. a–c MCF-7 model, with 24 h fulvestrant 1 µM treatment (+Fulv): MCF-7 ERα-LBDoe, MCF-7 FulvRes and MCF-7 NC (control). d–f TNBC model: MDA-MB-453/-231 ERα-LBDkd (knockdown) and MDA-MB-453/-231 NC (controls). RNA samples were extracted from each cell line and analyzed by RNA-Seq (n = 3/sample). a Heat map showing differentially expressed genes in MCF-7 ERα-LBDoe (+Fulv) and MCF-7 FulvRes (+Fulv), compared to MCF-7 NC. Gene expression (counts) was determined by using HTSeq, and differential expression was calculated as log2(fold change). Only genes with >1 fold change were taken under consideration for the analysis. Hierarchical clustering based on Euclidean Distance was carried out. b GSEA analysis based on gene counts and showing gene sets that are both highly and significantly (P < 0.05, FDR test) enriched in MCF-7 ERα-LBDoe (+Fulv) and MCF-7 FulvRes (+Fulv), compared to controls. NES normalized enrichment score. Enriched gene sets were grouped and color-coded considering their association with specific gene set collections. Please refer to the “Methods” section for details. c Enrichment plots of interest, derived from GSEA analysis described in b. d Heat map showing differentially expressed genes in TNBC ERα-LBDkd cells, compared to controls (NC). Calculation and analysis was carried out as described in a. e GSEA analysis showing gene sets that are both highly and significantly (P < 0.05, FDR test) enriched in TNBC NC samples compared to TNBC ERα-LBDkd, grouped/color-coded as in b. f Enrichment plots of interest, derived from GSEA analysis described in e. Source data are provided as Supplementary Data 5 file.

