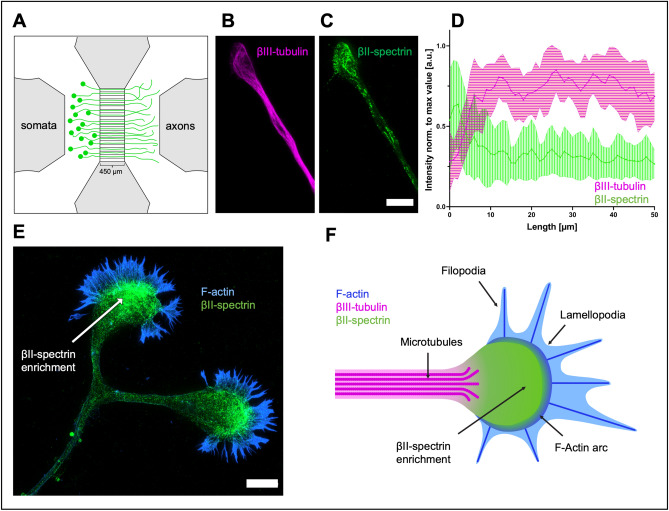
Figure 1.
Distribution of βII-spectrin and βIII-tubulin along the axon and the growth cone in non-axotomized rat cortical neurons. (A) Schematic drawing of a microfluidic chamber seeded with primary cortical neurons in the somatic department, transduced with AAV.EGFP virus. These neurons extend their axons through the microgrooves (length: 450 µm) into the axonal compartment within 11 days (green cells). (B and C) STED images of cortical neurons stained for spectrin and tubulin. Note that spectrin is enriched in the growth cone while tubulin concentration is decreased. Scale bar 5 µm. (D) Quantification of line intensity scans along the axon, starting from the growth cone tip. Spectrin fluorescence intensity peaks at the growth cone, whereas the tubulin signal is lower compared to the axon. Data is represented as mean ± SD. At least 5 biological replicates were analyzed, 11 axons were analyzed in total. (E) Representative STED image of a growth cone stained for spectrin and F-actin. Spectrin is enriched close to the actin filaments. Scale bar 5 µm. (F) Schematic drawing of a growth cone, showing an enrichment of βII-spectrin in the apical central domain of the GC and microtubules splaying into the GC. The depicted F-actin arc resembles the transition domain, whereas microtubules splay into the central domain of the GC.

