Figure 2.
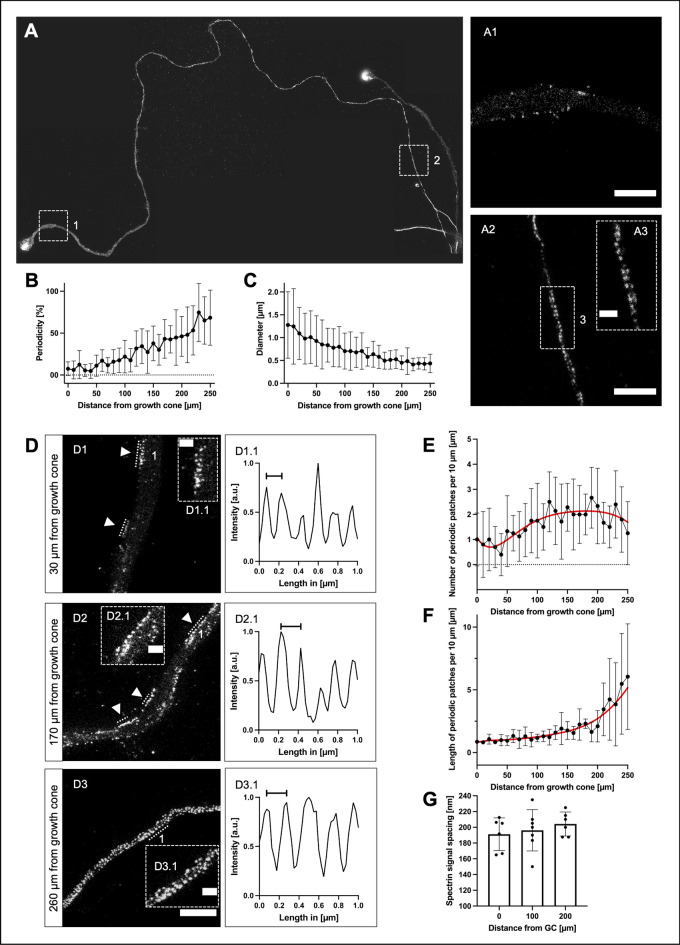
Development of the membrane-associated periodic skeleton along the growing axon. (A) Representative image of an axon with its growth cone, stained for spectrin, stitched from multiple STED images, up to 270 µm towards soma. A1 shows an enlarged axon section at 10 µm distance from the growth cone, no periodicity is visible (scale bar 2 µm). A2 shows an enlarged section of A, 270 µm from the growth cone (scale bar 2 µm). A3 shows an enlarged section of A2, MPS is clearly visible (scale bar 0.5 µm). (B) Graphical display of the development of periodicity over the length of the axon, starting from the growth cone base. Periodicity is increasing linearly towards the soma. Data is represented as mean ± SD. At least 5 biological replicates were analyzed, 11 axons were analyzed in total. Because of limitations in following axons back for extended lengths, not all axons could be included at distal points. (C) Reduction of the axonal diameter over the length of the axon, starting from the growth cone base, contrariwise to (B). Data is represented as mean ± SD. At least 5 biological replicates were analyzed, 11 axons were analyzed in total. Because of limitations in following axons back for extended lengths, not all axons could be included at distal points. (D) Three sections of an axon stained for spectrin, showing different stages of MPS development, were imaged using STED microscopy. D1 is 30 µm afar from the growth cone, D2 170 µm, and D3 260 µm. The arrowheads point to periodic patches, periodic arrangements of spectrin with at least three signals (scale bar 2 µm). D1.1 shows the periodic plot of a line intensity scan along the numbered periodic patch in D1. The marked distance is 150 nm. D2.1 shows a periodic line intensity scan along the numbered periodic patch in D2. The marked distance is 200 nm. D3.1 shows the periodic plot of a line intensity scan along the numbered periodic patch in D3. The marked distance is 200 nm. The scale bar length of the enlarged images D1.1, D2.1, and D3.1 is 0.5 µm each. (E and F) Quantification of parameters for the development of MPS along the axon, starting from the growth cone base. The number of periodic patches (E) increases, then decreases beyond 200 µm. The length of periodic patches (F) increases towards soma. Data is represented as mean ± SD. Red lines indicate estimated curve fits. At least 5 biological replicates were analyzed, 10 axons were analyzed in total. Because of limitations in following axons back for extended lengths, not all axons could be included at distal points. (G) Development of the spacing of spectrin tetramers in periodic patches in 10 µm long axonal segments at a distance of 0 µm, 100 µm, and 200 µm from the growth cone in non-axotomized axons. Although a slight increase of spectrin tetramer spacing along the axon is visible, no significant changes were detected using ordinary one-way ANOVA, followed by Turkey’s multiple comparisons test. Bars represent mean ± SD, at least 5 biological replicates were analyzed, 11 axons were analyzed in total.

