Figure 5.
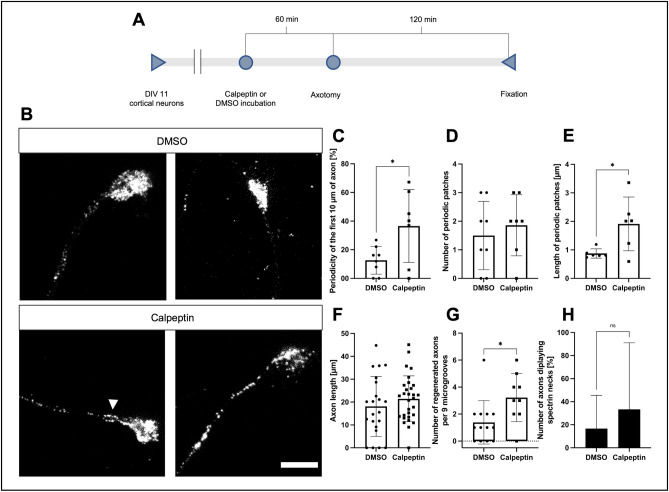
Effects of calpeptin treatment on spectrin periodicity and regeneration of axons after axotomy. (A) Schematic display of used test setup. 10 µM of calpeptin or equal amounts of DMSO were used for incubation. STED imaging was performed following fixation. (B) Representative STED images of cortical neurons treated with calpeptin or DMSO before axotomy, fixation after 2 h, scale bar 2 µm. The arrowhead points to a spectrin neck at the base of the growth cone. (C–E) Quantification of parameters for MPS development along the axon in regenerating axons treated with calpeptin, compared to regenerating DMSO controls. Analyzed were the first 10 µm of axon close to the growth cone. Periodicity (C) and size of periodic patches (E) were increased in calpeptin-treated axons. Bars represent mean ± SD. Unpaired t test (C and D) or Kolmogorov–Smirnov test (E) was performed. At least 7 axons were analyzed per condition, n = 3, 15 axons were analyzed in total. (F and G) Graphical display of axon length of regenerating neurons 2 h after axotomy. (F) shows no significant increase in axon length, while (G) shows a significant increase in regenerating axons per 9 microgrooves. Bars represent mean ± SD. Non-parametric Mann–Whitney U test was performed. At least 22 axons were analyzed per condition, n = 3, 52 axons were analyzed in total. (G) at least 27 microgrooves were analyzed per condition, n = 3, 198 microgrooves were analyzed in total. (H) Quantification of axons, treated with DMSO or calpeptin, displaying spectrin necks. Calpeptin-treated axons displayed a higher percentage of growth cones with spectrin necks. A spectrin neck was defined as an at least 600 nm long increase of spectrin signal at the axonal segment directly connected to the growth cone, not longer than 3 µm. At least 7 axons were analyzed per condition, n = 3, 15 axons were analyzed in total.

