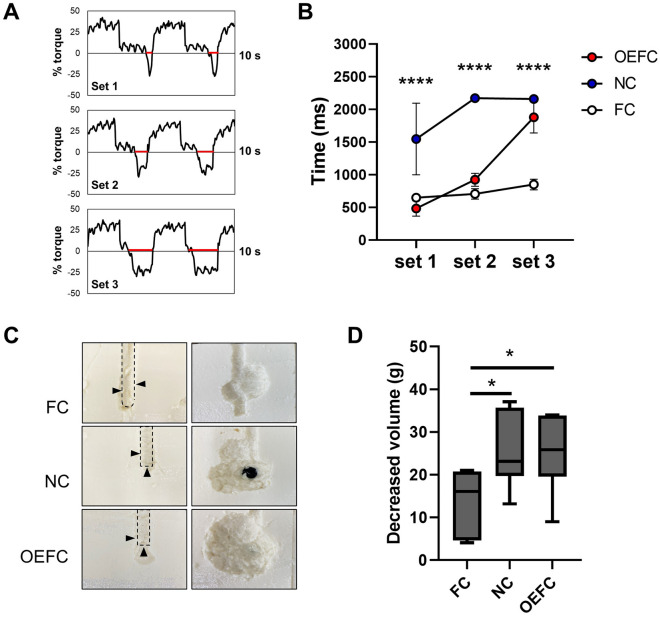
Figure 5.
MBW under constant speed. (A) Images of the output waveform of the required force (% torque) when the operation was performed using OEFC at 20 mm/s in PBC. Red line shows the time during which the force was required in the minus direction. (B) The time to apply the force in the minus direction for each set (n = 6). (C) Images of cross sections of PBC before (left side) and after (right side) the three sets of the operations. (D) Decreased volume of PBC after the three sets of the operations (n = 6). Black arrows indicate the location of each hole.

