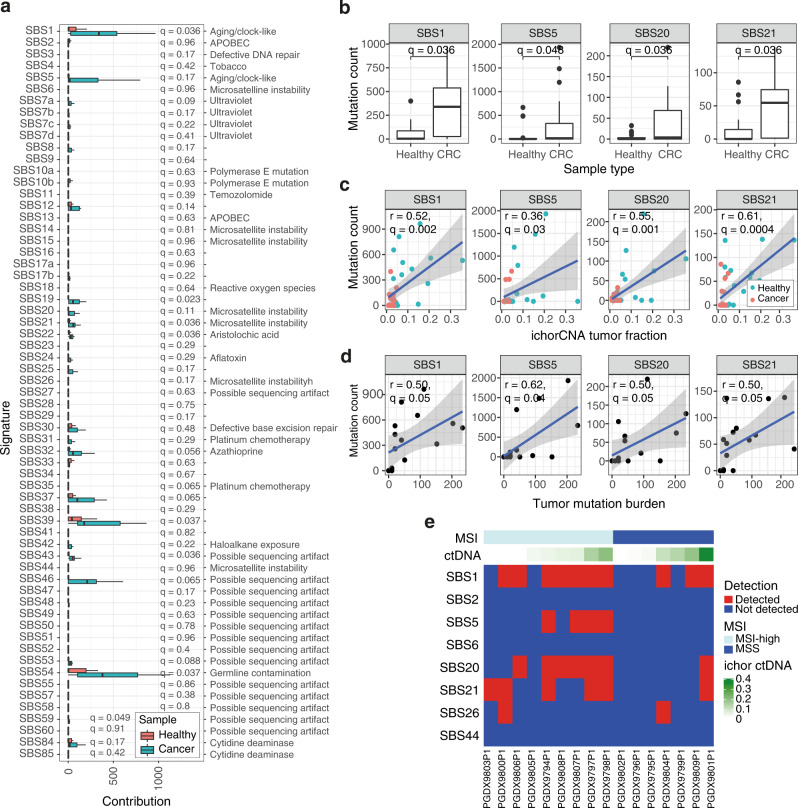
Fig. 2. Signature profiling in stage IV colorectal cancer (CRC).
a The number of mutations fitted to each signature is shown for plasma WGS data from healthy controls (n = 19, shown in red) and individuals with stage IV CRC (n = 16, shown in blue). Background subtraction was performed, and SNPs were retained (“Methods”). The potential etiology of each signature is listed12,45. Boxplots represent the median, upper and lower quartiles and whiskers indicate 1.5× IQR. One-sided Wilcoxon tests were performed, and Benjamini–Hochberg (BH)-corrected p values (q) are shown. APOBEC apolipoprotein B mRNA-editing enzyme. b Boxplots of aging and MSI signature contributions in healthy individuals (n = 19) and patients with CRC (n = 16). Mutation counts are background-subtracted (“Methods”). One-sided Wilcoxon tests were performed, and adjusted p values (q) are shown. Boxplots represent the median, upper and lower quartiles, and whiskers indicate 1.5× IQR. c One-sided Pearson correlations between tumor fraction and background-subtracted mutation count for aging and MSI signatures are shown for healthy individuals (n = 19, shown in red) and patients with CRC (n = 16, shown in blue). Adjusted p values (q) are shown. The gray shaded area indicates the 95% CI of the fitted linear model. d One-sided Pearson correlations between tumor mutation burden (TMB) and mutation count per signature are shown for each patient (n = 16). Adjusted p values (q) are shown. The gray shaded area indicates the 95% CI of the fitted linear model. e Heatmap of selected aging and MSI signatures detected in CRC plasma samples with 95% specificity (n = 16, “Methods”). Detected signatures in each sample are indicated in red, non-detected signatures are shown in blue. Samples are annotated with ichorCNA ctDNA fraction and microsatellite instability status (MSI)21. Source data are provided as a Source data file. MSS microsatellite stable.

