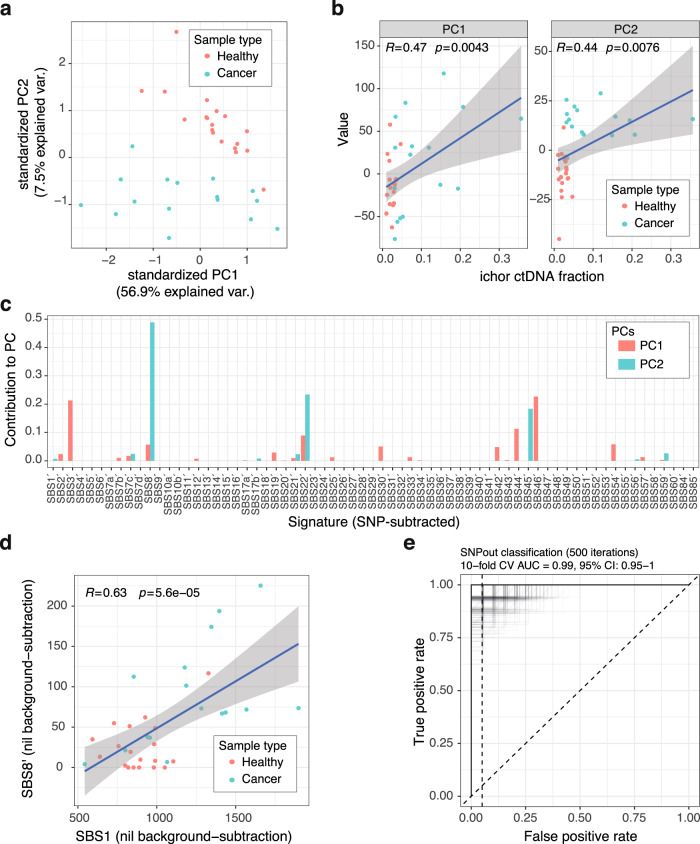
Fig. 3. Cancer detection in stage IV colorectal cancer (CRC).
a SNP-subtracted mutation profiles from 0.3× WGS of plasma from healthy individuals (n = 19) and patients with stage IV CRC (n = 16) were used as input for Principal Component Analysis (PCA). Healthy and cancer samples are shown in red and blue, respectively. PC principal component. b PC1 and PC2 were correlated against ctDNA fraction determined by ichorCNA. Both PCs showed significant correlation (PC1, p = 0.0043; PC2, p = 0.0076, two-sided Pearson correlation). Healthy and cancer samples are shown in red and blue, respectively. The gray shaded area indicates the 95% confidence interval of the fitted linear model. c The signature contributions to PC1 and PC2 were assessed by fitting signatures to the SBS profile of each PC. Signature contributions to each PC are shown as proportions. SBSn´ indicates SNP-subtracted mutation data fitted to SBSn, where n is an integer. PC1 is shown in red, PC2 is shown in blue. d In samples from healthy individuals (n = 19) and patients with stage IV CRC (n = 16), SBS1 contribution was significantly correlated with SBS8´ (p = 5.6 × 10⁻⁵, two-sided Pearson correlation). Healthy and cancer samples are shown in red and blue, respectively. The gray shaded area indicates the 95% confidence interval of the fitted linear model. e A random forest model was used to classify cancer samples (n = 16) vs. healthy (n = 19) using SNP-subtracted mutation profiles. Ten-fold nested cross-validation repeated 500 times was used. Each iteration is shown. A Receiver Operating Characteristic curve is shown (AUC 0.99, 95% CI 0.95–1.00). Source data are provided as a Source data file. AUC area under the curve, CV cross-validation.

