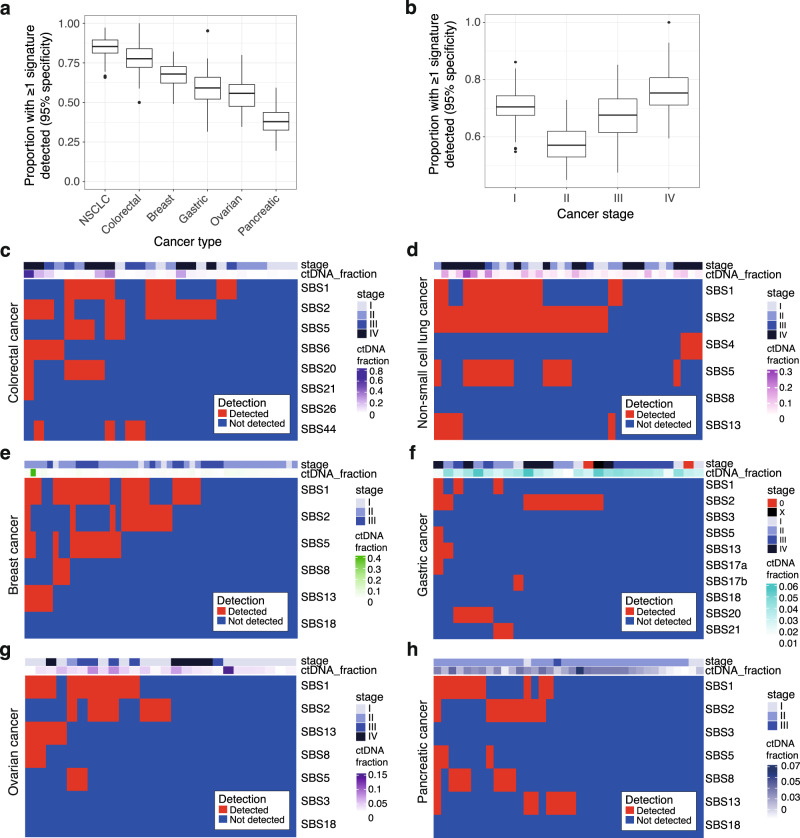
Fig. 4. Signature profiling of the DELFI cohort.
a Boxplots showing the proportion of patients from the DELFI cohort (n = 199) with at least one signature detected in plasma. Data are split by cancer type. Signatures relevant to each cancer type were assessed for detection with 95% specificity using 10M reads (“Methods”). Data were bootstrapped with 100 iterations. Boxplots show the bootstrapped median, upper and lower quartiles, and whiskers indicate 1.5× IQR. Outliers are shown as points. NSCLC non-small cell lung cancer. b Boxplots showing the proportion of patients with stage I–IV disease from the DELFI cohort (n = 197) with at least one signature detected in plasma are shown. Data are split by cancer stage. Boxplots show the bootstrapped median, upper and lower quartiles, and whiskers indicate 1.5× IQR. Outliers are shown as points. c–h Heatmap of detected signatures for stage I–IV colorectal cancer (n = 43), stage I–IV NSCLC (n = 27), I–III breast cancer (n = 48), stage I–IV, 0, and X gastric cancer (n = 27), I–IV ovarian cancer (n = 26), stage I–III pancreatic cancer (n = 34). Detected signatures within a sample are shown in red, undetected signatures are shown in blue. Cancer type, disease stage, and ctDNA fraction are annotated. Source data are provided as a Source data file.

