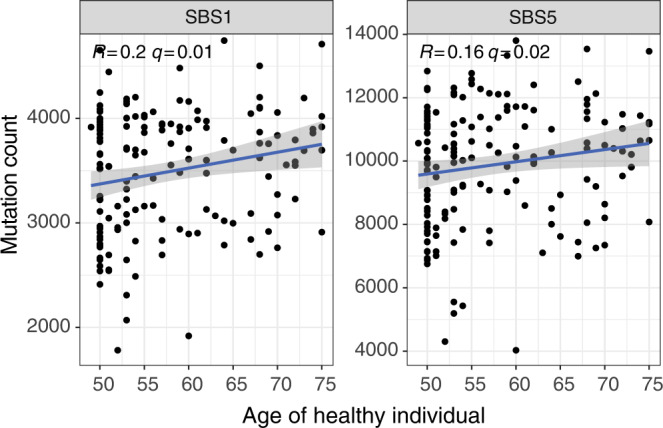
Fig. 5. Profiling aging signatures in healthy individuals.

One hundred and fifty-nine healthy individuals’ plasma WGS data (50M reads) from the study in ref. 9 study, sequenced on the same machine, were used to explore the relationship between aging signatures in plasma and chronological age. We correlated known aging/clock-like27 signatures (SBS1 and SBS5) against age. Both signatures showed a significant positive correlation with age (one-sided Pearson test). Adjusted p values (q) are shown. The gray shaded area indicates the 95% confidence interval of the fitted linear model. All putative aging-correlated signatures are correlated with age in Supplementary Figs. 13 and 14. Source data are provided as a Source data file.
