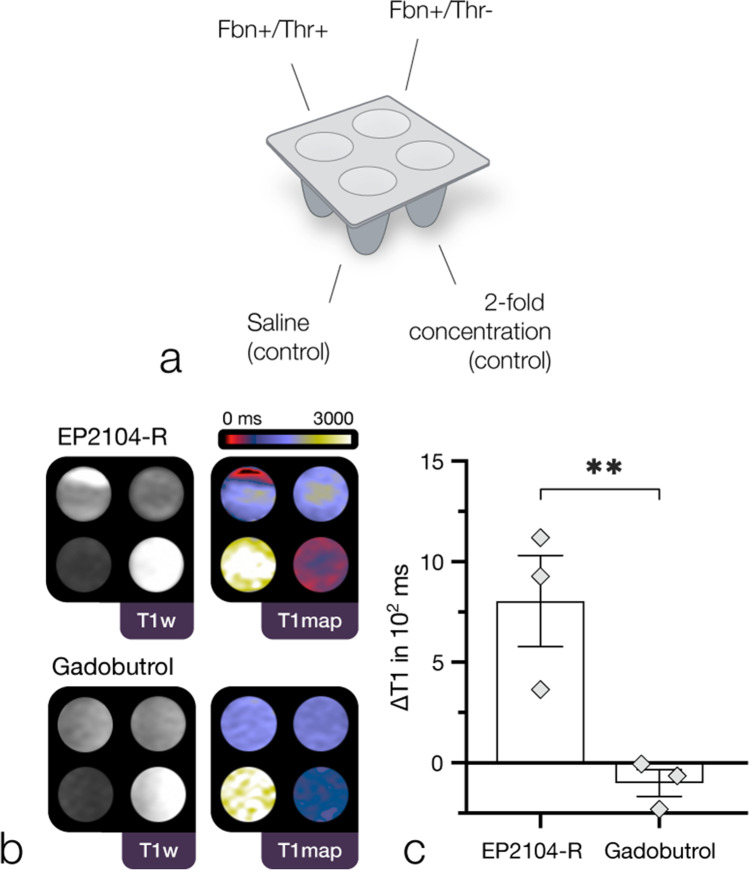
Fig. 2.
Fibrin binding (in vitro) assay. First panel (a) illustrates the experimental setup using 3D-printed multi-well plates (fitted to the phased array coil). Fbn, fibrinogen; Thr, thrombin. Arrangement as shown in panel b: top left, Fbn + /Thr + ; top right, Fbn + /Thr-; bottom left, saline (control); bottom right, twofold higher concentration (control). Panel b shows a representative binding experiment with EP2104-R (25 µM) and gadobutrol (100 µM): In contrast to EP2104-R, which presented a substantial local decrease in longitudinal relaxation time for wells with fibrinogen and pre-activated thrombin, suggestive for strong binding to the fibrin pellet, gadobutrol exhibits no particular enhancement pattern. Third panel (c) shows substantial difference in ∆T1 (determined from respective Fbn + /Thr + and Fbn + /Thr- samples) between EP2104-R and gadobutrol (p = 0.009, n = 3, independent samples t-test, E2.2). M ± SEM. In the unbound state, EP2104-R exhibits higher relaxivity due to internal motion of the chelate complex. p-value < .05 was considered statistically significant. **p-value < 0.01

