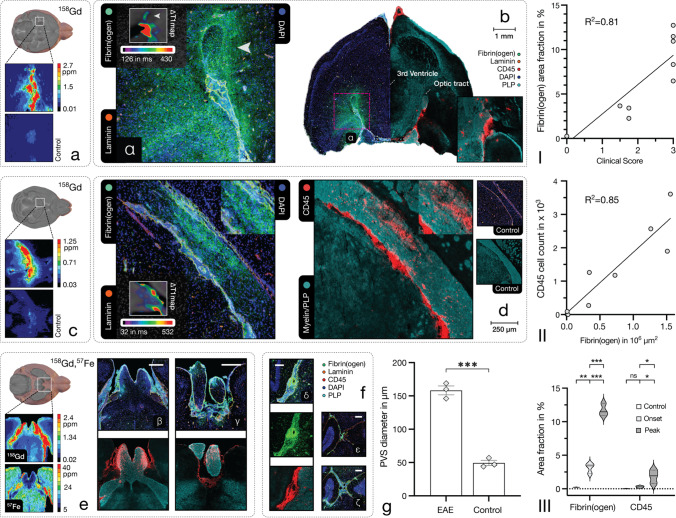
Fig. 4.
Fibrin(ogen) deposition and fibrin-targeting molecular MRI. Fibrin(ogen) deposition corresponded to clinical disability and disease score (R2 = 0.81, p < .001, n = 11) as well as with immune infiltration (R2 = 0.85, p < .001, n = 9) in EAE, as shown in panel I and II. Panel III shows group differences in fibrin(ogen) and CD45 area fraction between control, disease onset and disease peak (from left to right) samples (n = 3, one-way ANOVA with Holm-Šídák’s multiple comparisons test; E2.6, fibrin(ogen), E2.7, CD45) illustrated as a violin plot. The following panels (a–e) demonstrate molecular imaging of CNS fibrin deposition in early disease stages: Panels a and b present periventricular inflammation with corresponding decrease in longitudinal relaxation time and interstitial Gd detection in tissue samples. Panel b shows matching immunohistopathology (same hemisphere of two adjacent slices) with fibrin(ogen) deposits and immune infiltrates with associated demyelination of the optic tract (see white arrow). Prominent CNS migration through the choroid plexus was apparent in an adjacent slide, demonstrated in the inset. Panels c and d show inflammation affecting the ventral hippocampal commissure and fimbria with respective decrease in longitudinal relaxation time and Gd detection in LA-ICP MS. Centrifugal fibrin(ogen) deposits, immune cell infiltration and pronounced demyelination adjacent to the lateral ventricle, as shown in panel d, suggest leucocyte migration through the choroid plexus. Panel e shows extensive inflammation of the optic chiasm (β) and optic nerve (γ) with associated fibrin(ogen) deposition and Gd detection. Panel f demonstrates the enlarged subarachnoid space in EAE: Inflammation within the enlarged subarachnoid space (δ) is associated with fibrin(ogen) deposition, which is apparent in MRI with EP2104-R. Subpanels (ε, ζ) compare the enlarged cerebellar subarachnoid space in EAE (ζ) to a control (ε). Correspondingly, there was a statistically significant enlargement of the subarachnoid space in EAE compared to healthy controls (p < .001, n = 3, independent sample one-tailed t-test, E2.8), which is shown in panel g. M ± SEM. Scale bars, 1 mm (b), 250 µm (d), 200 µm (β–δ), 250 µm (ε, ζ). p-value < 0.05 was considered statistically significant. *p-value < .05, **p-value < .01, ***p-value < .001. ns, non-significant

