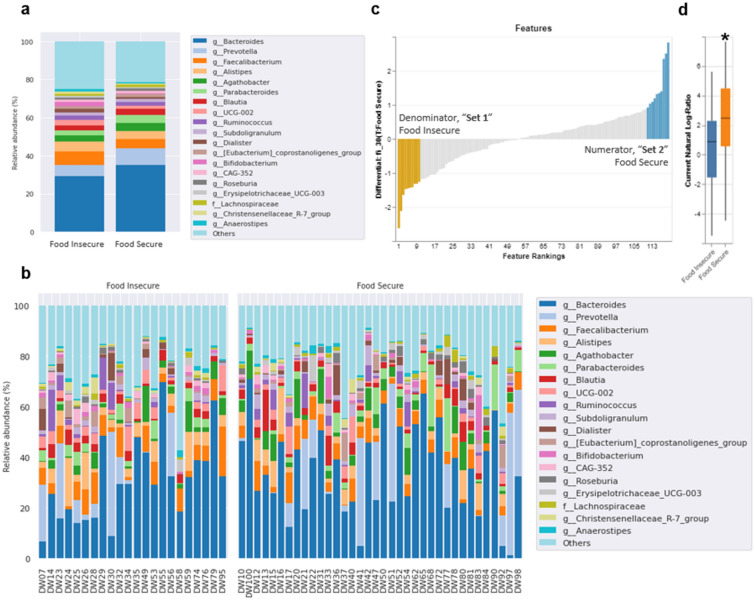
Figure 3.
Taxonomic analysis of fecal microbiome by food security status. (a) Taxonomy bar plot of the top 20 most abundant taxa at the genus level for both groups (n = 60). Less abundant taxa are not displayed. (b) Taxonomy bar plot of individual subjects at the genus level by FI (n = 22) and FS status (n = 38). Less abundant taxa are not displayed. Note, where resolution at the genus level was not possible taxa are described at the lowest feature level obtained (i.e., f = family). (c) Comparison of the log ratio of the 10 lowest (“Set 1”) and 10 highest (“Set 2”) ranked taxa associated with food security status (after filtering, n = 58). (d) FS individuals had a significantly greater log ratio of set 2 compared to set 1 (Mann–Whitney U test: p < 0.05).

