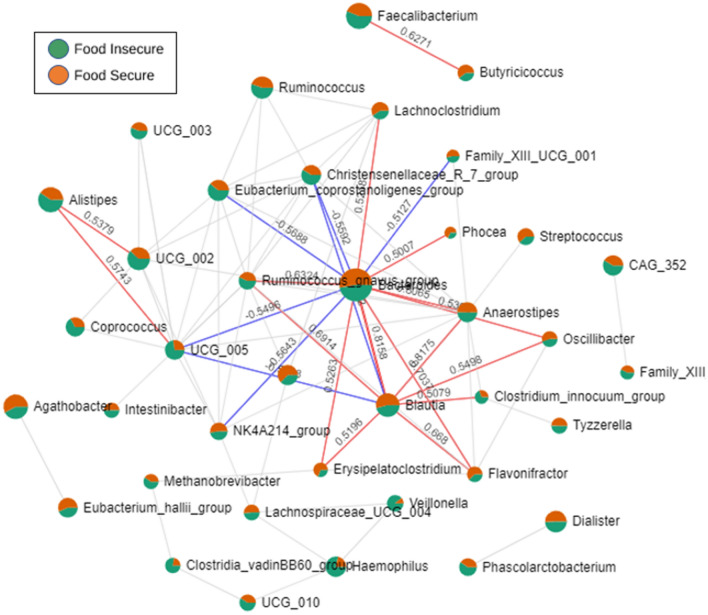
Figure 4.
Correlation analysis of taxa at the genus level between food insecurity and food security status. Network analysis between abundant taxa constructed from SparCC correlation coefficients (|R2| > 0.5, p < 0.01). Note, each node represents a microbe by abundance between food security status, with the lines (and corresponding values) indicating the correlation coefficients between the genera. Blue edges are negative correlations and red edges mean positive correlations.

