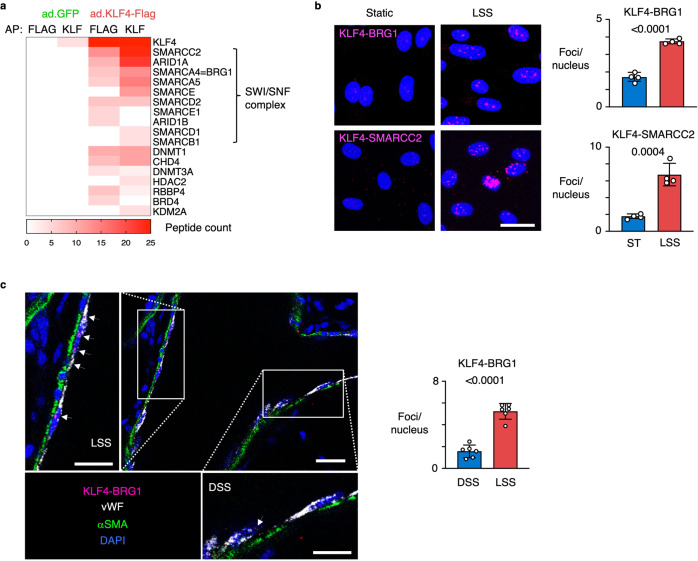
Fig. 3. KLF4 interacts with the SWI-SNF nucleosome remodeling complex to increase chromatin accessibility.
a Heatmap showing the spectral counts obtained by Affinity Purification followed by Mass Spectrometry (AP-MS) of PAEC transduced with adenoviral vectors encoding a Flag-tagged mutant of KLF4 or GFP control. AP was performed using anti-Flag antibodies (FLAG) and anti-KLF antibodies (KLF). Proteins were inferred from the peptides against the human UniProt using an FDR of 1%. n = 2 experimental replicates. b Representative images of Proximity Ligation Assays (PLA) (left panel) of PAEC exposed to 15 dyn/cm2 of LSS or ST conditions for 24 h, show an interaction of KLF4 with BRG1 and SMARCC2 under LSS (magenta). Nuclei were stained with DAPI (blue). Number of foci per nucleus were quantified in 10 non-overlapping random fields of view per replicate (right panel). n = 4 experimental replicates. Data shown as the mean +/− s.e.m. P values were determined by Student’s two-tailed t-test. Scale bar, 20 μm. c Representative image of KLF4-BRG1 PLA in healthy rat lung tissue. The original PLA protocol was modified with longer incubation times to allow the reagents to fully penetrate the 350 μM thick sections. Note the interaction of KLF4 with BRG1 at straight sites of the vasculature that are exposed to LSS (upper left insert), while sites at bifurcations which are exposed to disturbed shear stress (DSS) do not show the KLF4-BRG1 interaction (bottom right insert). Bar graphs show the average number of foci per nucleus quantified in regions of DSS or LSS at 6 random bifurcations. KLF4-BRG1 interaction (magenta); vWF (gray, pseudo-color); αSMA (green). Nuclei were stained with DAPI, (blue). Scale bar, 20 and 10 μm in the higher magnifications. Data shown as the mean +/− s.e.m. P value was determined by Student’s two-tailed t-test. Source data are provided as a Source Data file.

