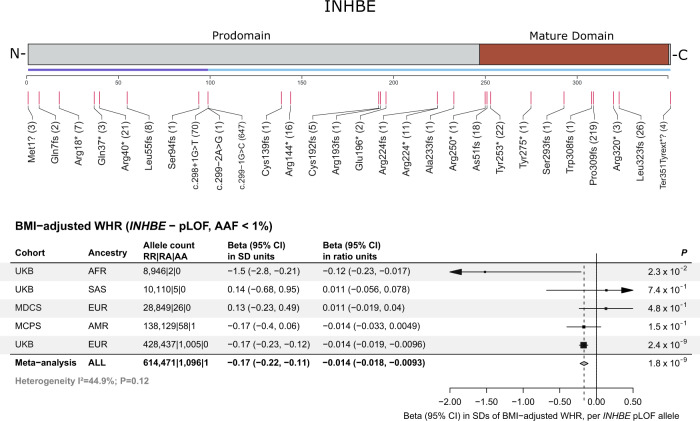
Fig. 3. Protein-truncating variants in INHBE associated with favorable fat distribution.
The top panel is a linear model of the INHBE protein with prodomain and mature domains in gray and brown, respectively. An exon track shows the two exons of the gene (in purple and blue). Predicted loss of function (pLOF) variants identified by exome-sequencing and included in the gene-burden analysis are shown below the exon track, with numbers in parenthesis corresponding to the number of carriers for each allele. The bottom panel shows associations with fat distribution for pLOF variants in INHBE across cohorts. P-values are from two-sided Wald tests. Markers represent the beta estimates while error bars represent 95% confidence intervals. The gray diamond represents meta-analysis estimates. BMI body mass index, WHR waist-hip ratio, pLOF predicted loss of function, AAF alternative allele frequency, UKB UK Biobank, MDCS Malmö Diet and Cancer Study, MCPS Mexico City Prospective Study, AFR African ancestry, SAS south-Asian ancestry, EUR European ancestry, AMR admixed-American ancestry, RR reference-reference homozygous genotype, RA reference-alternative heterozygous genotype, AA alternative-alternative homozygous genotype, CI confidence interval, SD standard deviations, P P-value.

