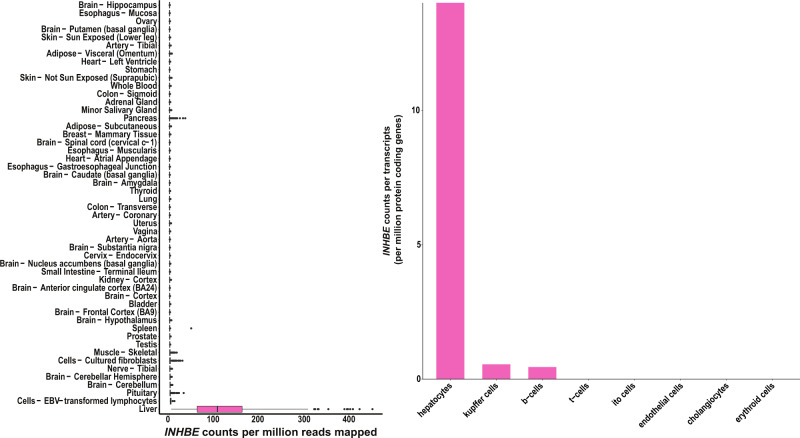
Fig. 4. INHBE mRNA expression in humans across tissues and liver cell-types.
The left panel shows normalized mRNA expression for INHBE in counts per million (CPM) across tissues from the Genotype Tissue Expression (GTEx) consortium107, box plots depict the median, interquartile range, and range of CPM values across individuals for each tissue107. The right panel shows normalized cell-type specific expression within liver in counts per transcripts per million protein coding genes (pTPM) from the Human Protein Atlas (HPA)108.

