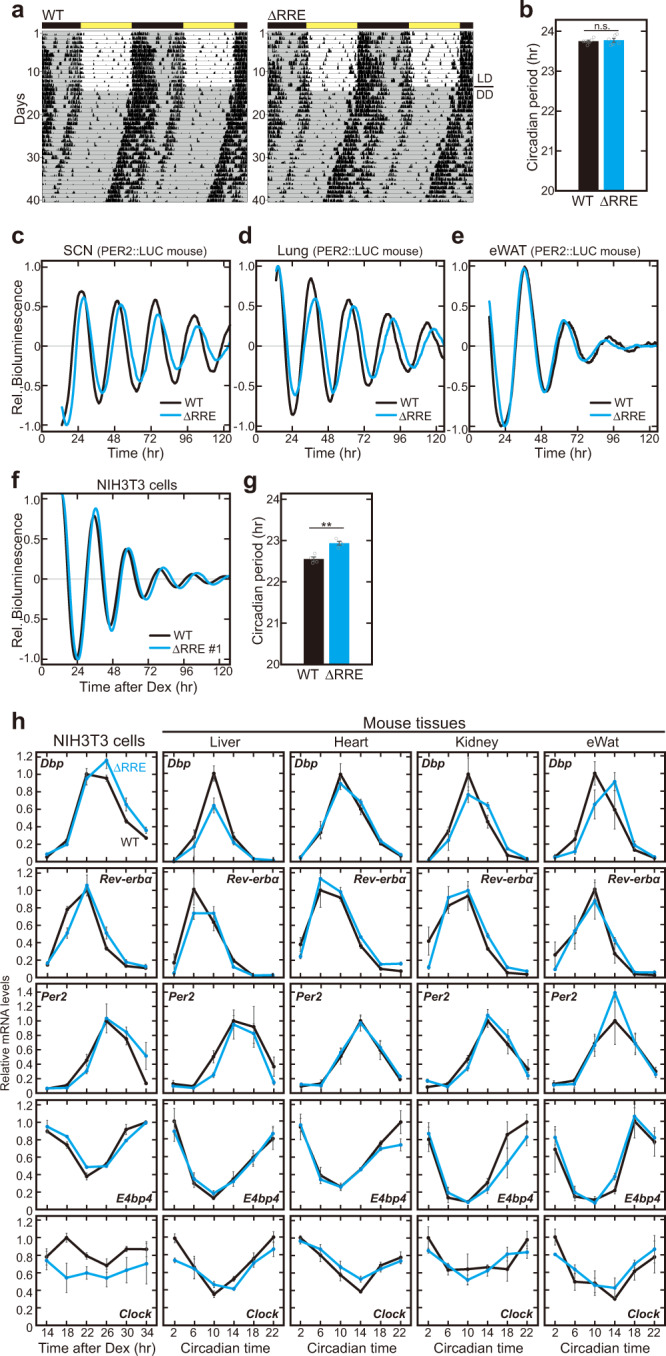
Fig. 2. Circadian oscillation is apparently maintained in the absence of the rhythmic transcription of Bmal1.

a Double-plotted wheel-running activities of representative ΔRRE homozygous and littermate WT mice. Horizontal black and yellow bars above each actogram indicate dark and light phases in the light-dark (LD) cycle, respectively. b The circadian period of the activity rhythm under the DD condition determined via a chi-square periodogram procedure based on the locomotor activities in days 11 to 24 after the start of DD condition. Data are means ± SEM from 6 WT mice and 6 homozygous ΔRRE mice. Two-sided Student’s t test, n.s., P ≥ 0.05 vs. WT. Source data are provided as a Source Data file. c–e Representative relative bioluminescence rhythms in the SCN slice (c), lung (d) and eWat (e) of PER2::LUC-WT and PER2::LUC-ΔRRE mice. The tissues are cultured on the Millicell membrane for the long-term monitoring. Blue and black lines indicate the ΔRRE mutants and WT (littermate) controls, respectively. f, g Representative relative bioluminescence rhythms from the ΔRRE and WT NIH3T3 cells. A Luciferase reporter containing RREs was transiently transfected to monitor the bioluminescent rhythms. Cells were synchronized by 2-hr pulse treatment with dexamethasone just before the monitoring. The circadian periods of the ΔRRE mutant and WT cells are shown in panel (g). Data are means ± SEM (n = 4). Two-sided Student’s t test, **P < 0.01 vs. WT (P = 0.0016). Source data are provided as a Source Data file. h Temporal mRNA expression profiles of five clock genes (Dbp, Rev-erbα, Per2, E4bp4 and Clock) in NIH3T3 cells and mouse tissues. The mRNA level of each gene was normalized by Rps29. Bmal1 mRNA levels in the ΔRRE mutant cells and mouse tissues were judged as arrhythmic by the analysis of BIO_CYCLE. Also, Clock mRNA level in NIH3T3 cells was judged as arrhythmic in both WT and the ΔRRE mutant. Indicated cells and tissues were harvested at 4-hr intervals, followed by quantitative RT-PCR. Data are means ± SEM (n = 3 for WT, n = 4 for ΔRRE). Blue and black lines indicate the ΔRRE mutants and WT (littermate) controls, respectively.
