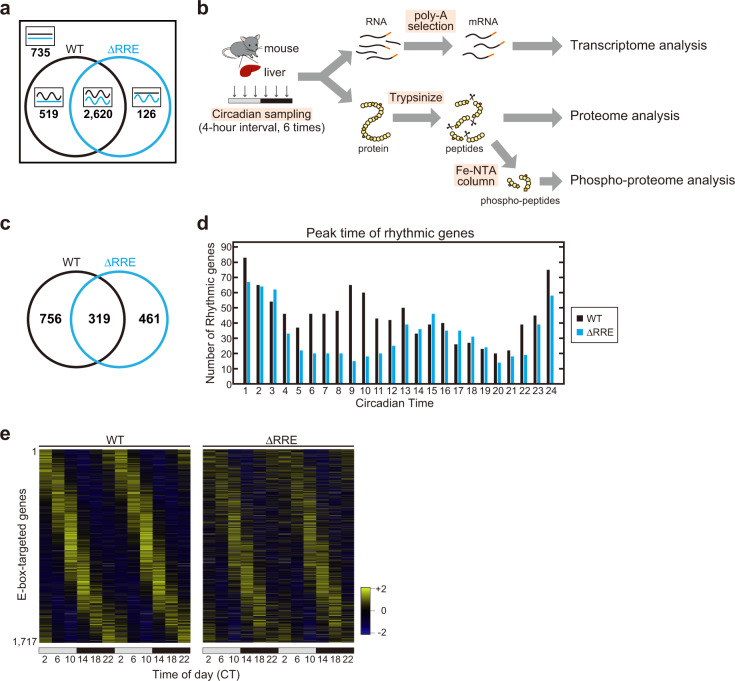
Fig. 5. The RRE-mediated feedback loop increases the robustness of the circadian clock.
a Venn diagram (sizes not to scale) depicting the number of parameter sets that permit oscillations in the ΔRRE mutant and WT models. Four thousand parameter sets were obtained by randomly perturbing the values of the model parameters. b The experimental procedures for the transcriptome and proteome analyses. The livers were harvested from the ΔRRE homozygous mice and the control WT mice at 4-hr intervals. The cDNA library was prepared from poly(A)-tailed RNA, and sequenced for transcriptome analysis. The trypsinized peptides were subjected to LC–MS/MS analysis for total proteome analysis, and the phosphorylated peptides were enriched by FeNTA column for phospho-proteome analysis. c Venn diagram (sizes not to scale) depicting the number of rhythmic genes in the transcriptome analysis of the ΔRRE mutant and WT mouse liver. d A histogram of the number of rhythmic genes peaking at each circadian time. Blue and black indicate the ΔRRE mutants and WT littermates, respectively. e Heat maps of mRNA levels of 1717 E-box-targeted genes expressed in the RNA-Seq. Genes were ordered by their peak phases in WT mice from early day to late night. The FPKM values were normalized so that the mean and the variance were set to 0 and 1, respectively, for each row of the maps.

