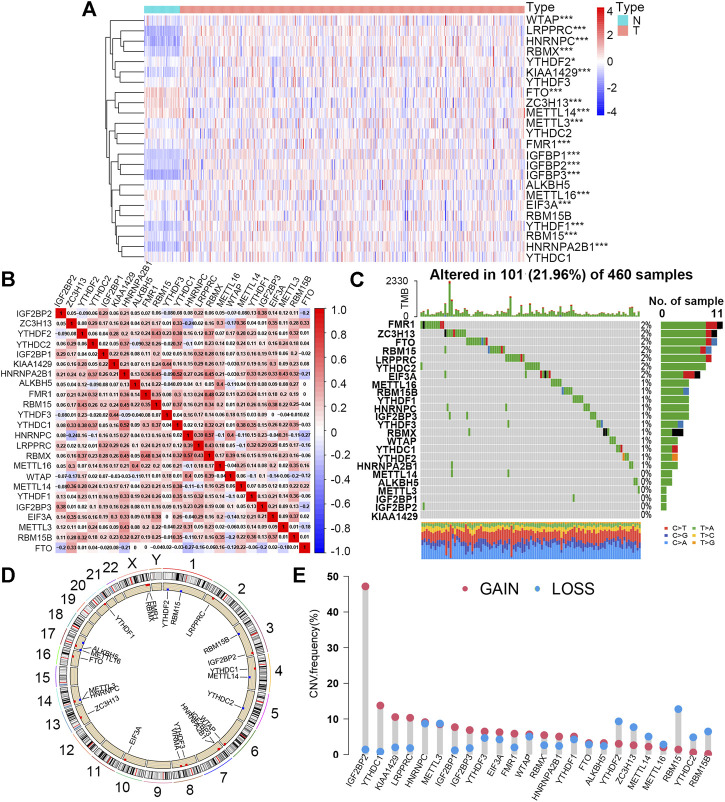
FIGURE 1.
Expression levels and mutation features of 24 m6A regulators in the smoking-associated LUSC cohort from TCGA database. (A) Expression differences of 24 m6A regulators between normal (N) (n = 49) and tumor (T) (n = 473) samples (*p < 0.05; ***p < 0.001). (B) Expression correlation analysis of 24 m6A regulators in the smoking-associated LUSC cohort. Red and blue refer to positive and negative correlation, respectively. (C) Somatic mutation types and frequency of 24 m6A regulators in 460 LUSC samples with smoking history. (D) Locations and CNV types of 24 m6A genes on 24 different chromosomes. Red and blue refer to the increased and decreased CNV types, respectively. (E) CNV frequency of 24 m6A regulators in the smoking-associated LUSC cohort. Red and blue refer to the increased and decreased CNV types, respectively.

