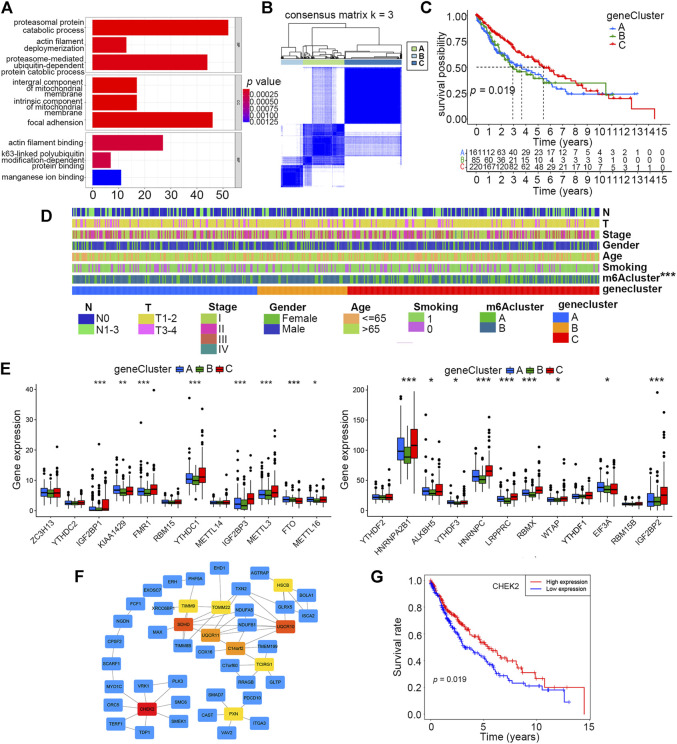
FIGURE 3.
Identification of three distinct gene clusters based on DEGs of m6A clusters A and B. (A) Enrichment analysis of 1814 DEGs of m6A clusters A and B by GO. (B) Identification of three distinct gene clusters based on 230 prognostic DEGs of m6A clusters A and B via unsupervised consensus clustering analysis. (C) Overall survival differences among m6A clusters A, B, and C by Kaplan–Meier survival analysis. Log-rank p = 0.019. (D) Differences in clinical characteristics and m6A clusters among gene clusters A, B, and C. (E) Differences in expression levels of 24 m6A regulators among gene clusters A, B, and C (*p < 0.05, **p < 0.01, and ***p < 0.001). (F) Hub gene identification among DEGs by Cytoscape software and the Degree algorithm. The top 10 hub genes are marked from pale yellow to deep red, and the darker the color, the more important it is. The other related genes are labeled blue. (G) Overall survival differences between high and low expression levels of CHEK2 in the smoking-associated LUSC cohort by Kaplan–Meier analysis. Log-rank p = 0.019.

