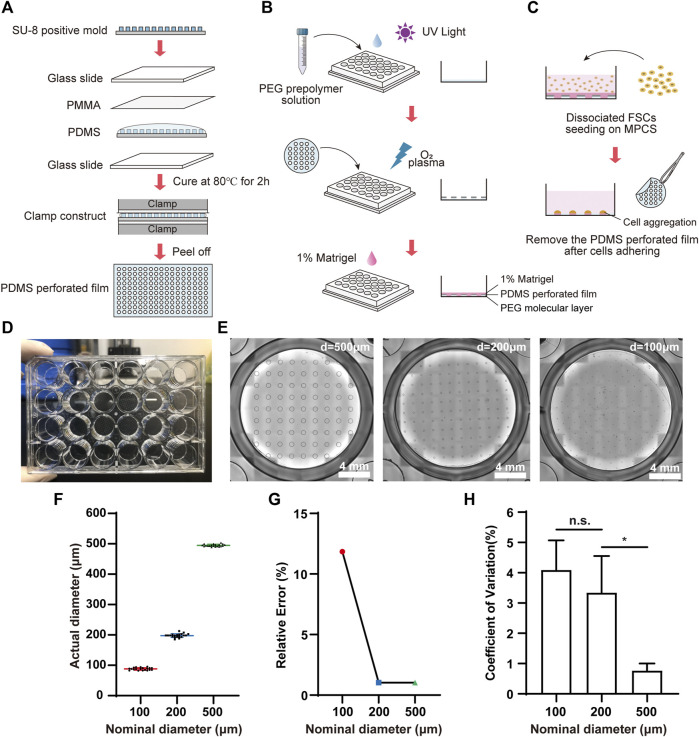
FIGURE 1.
Fabrication and characterization of MPCS. Schematic diagram of (A) the fabrication process for perforated PDMS film, (B) PEG coating, and (C) cell seeding on the MPCS. (D) Photograph of MPCS. (E) Bright field images of MPCS with circular patterns of 500 μm, 200 μm, and 100 μm in diameter from left to right, respectively. (F) Scatter plot (mean ± SD, n = 20), (G) Relative error (n = 20), and (H) CVs of actual diameters of the perforated PDMS film (n = 6). Data are the mean ± SD and analyzed by One-way analysis of variance, *p < 0.05, **p < 0.01, ***p < 0.001, ****p < 0.0001.

