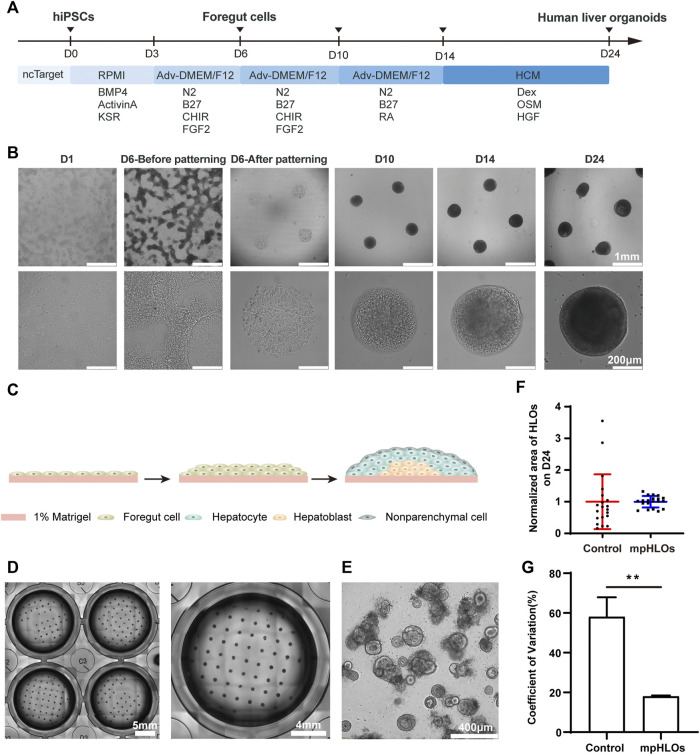
FIGURE 2.
Characterization of hiPSC-derived mpHLOs. (A) Culture timeline diagram of mpHLOs. (B)Time-lapse images of generation of mpHLOs. mpHLOs are circular patterns with a diameter of 500 μm. (C) Schematic diagram of mpHLOs. (D) Bright-field images of mpHLOs in 24-well plate. (E) HLOs in Matrigel dome. (F) Normalized area of HLOs (n = 20). (G) CVs of HLOs (n = 6). Data are the mean ± SD and analyzed by Student’s t test, *p < 0.05, **p < 0.01, ***p < 0.001, ****p < 0.0001.

