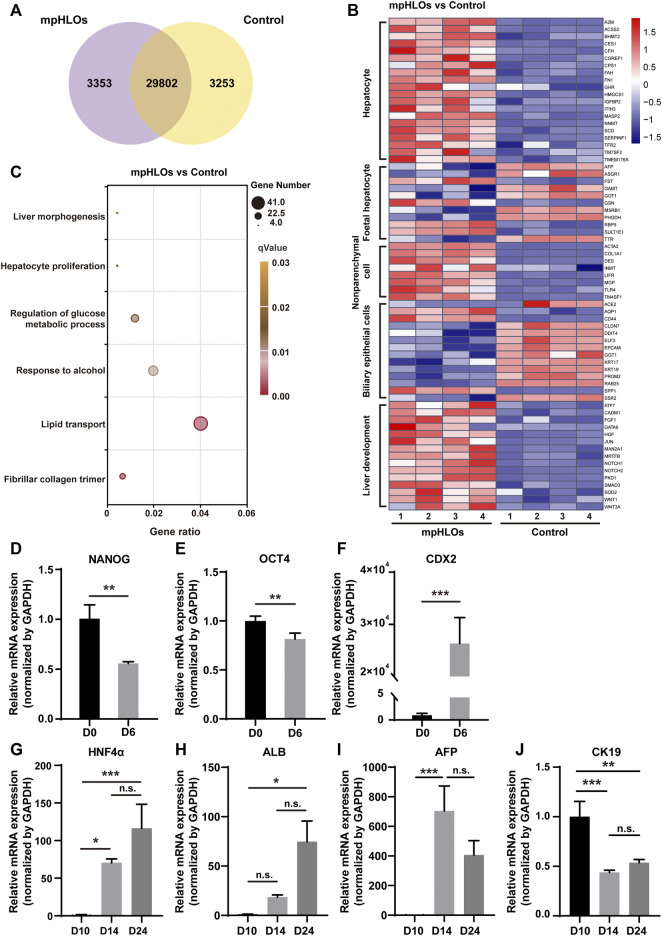
FIGURE 3.
The transcriptomic analysis and relative mRNA expression of key genes in differentiation process. (A) Venn diagram shows the number of co-expressing and differentially expressing genes between mpHLOs and HLOs in the Matrigel dome (Control). (B) Heat map shows gene expression in hepatocyte, fetal hepatocyte, nonparenchymal cell, biliary epithelial cell, and liver development. (C) Bubble diagram indicates up-regulated genes enrichment by Gene Ontology analysis. (D) The pluripotency gene NANOG and (E) OCT4. (F)The posterior foregut gene CDX2. (G) The hepatic gene HNF4α. (H) The hepatic gene ALB. (I) The hepatic progenitor gene AFP. (J) The cholangiocyte gene CK19. Gene expression is shown as fold changes during two-week differentiation relative to the levels in D10 group, as determined by qPCR. Data are the mean ± SD (n = 3) and analyzed by Student’s t test or One-way analysis of variance, *p < 0.05, **p < 0.01, ***p < 0.001, ****p < 0.0001.

