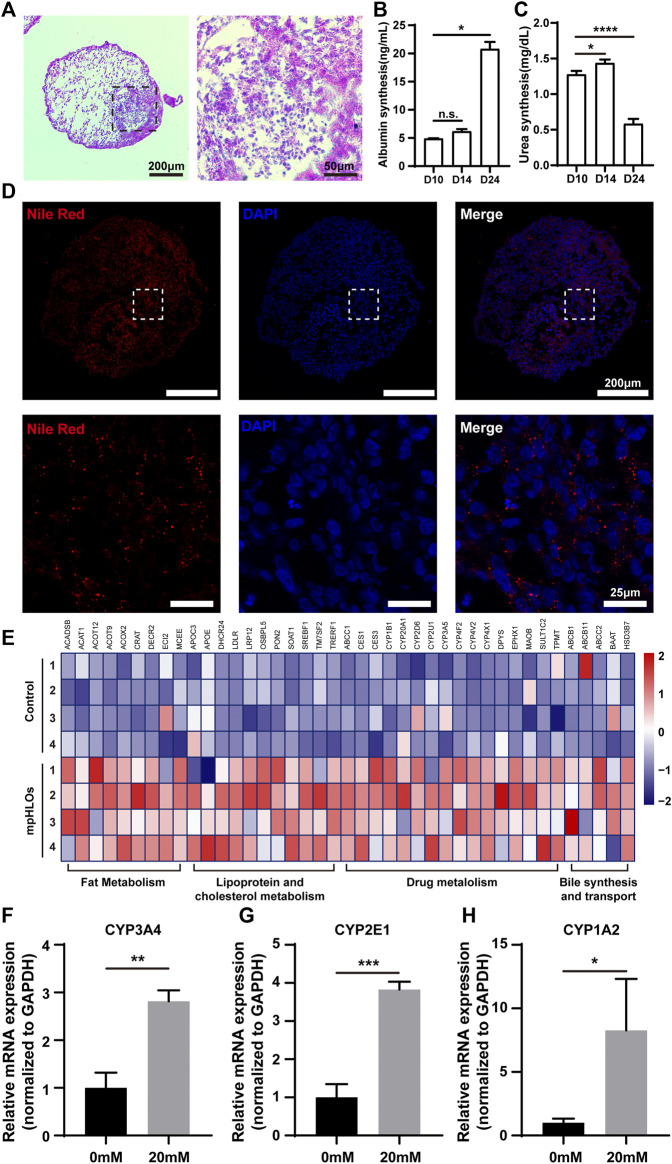
FIGURE 5.
Functional characterization of mpHLOs. (A) Glycogen storage of mpHLOs. (B–C) Albumin and urea secretion during two-week differentiation. (D) Lipid accumulation of mpHLOs. (E) Heat map indicates differential gene expression analysis of liver specific function genes. (F–H) Relative mRNA expression of CYP450 enzymes (CYP3A4, CYP2E1, and CYP1A2) after 48 h treatment with 0 and 20 mM APAP. Data are shown as the fold changes in expression relative to the levels without treatment. Data are the mean ± SD (n = 3) and analyzed by Student’s t test or One-way analysis of variance, *p < 0.05, **p < 0.01, ***p < 0.001, ****p < 0.0001.

