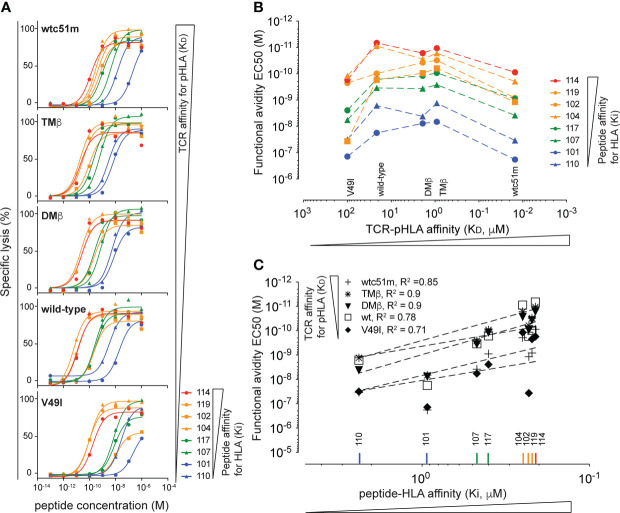
Figure 4.
Hierarchical analysis of TCR-pHLA KD affinity versus peptide:HLA Ki affinity. (A) Curves obtained from parallel cytotoxic killing assays of primary CD8 T cells expressing five NY-ESO-1157-165-specific TCRs of incremental affinities (very low affinity KD of V49I < 100μM, wild type KD = 21.4 μM, optimized DMβ = 1.91 μM and TMβ = 0.91 μM and very high affinity TCR wtc51 = 0.015 μM) against 8 NY-ESO-1157-165 peptide variants of increasing (n = 4 to 8). (B) Functional avidity values (EC50) obtained from the parallel killing assays of the NY-ESO-1157-165-specific T cells plotted against the KD affinity of the TCR for the pHLA. (C) Correlation analysis between the functional avidity values (EC50) of the NY-ESO-1157-165-specific T cells and the Ki affinity of the respective target peptides. R square values are displayed.

