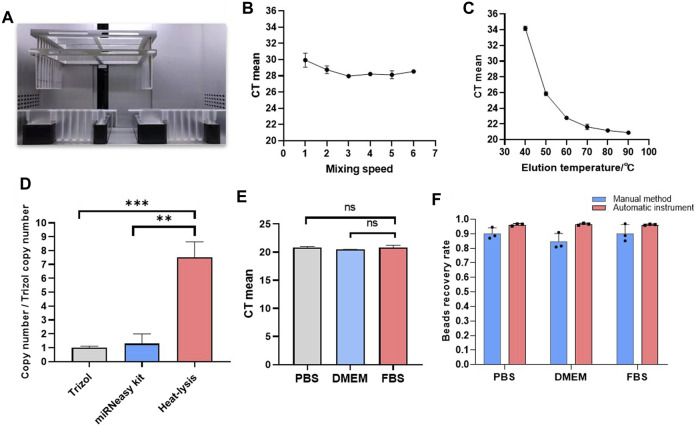
FIGURE 4.
Automated EV isolation and miRNA extraction. (A) Internal structure of the automated instrument. (B) Optimization results for elution temperature. (C) Optimization results for mixing speed. (D) Copy number of miRNAs from different EV miRNA extraction methods. (E) CT values from EV miRNA extraction in different matrixes. (F) Recovery rate for magnetic beads by the manual method and automatic method (*p < 0.05, **p < 0.01, and ***p < 0.001, ns, non-significant).

