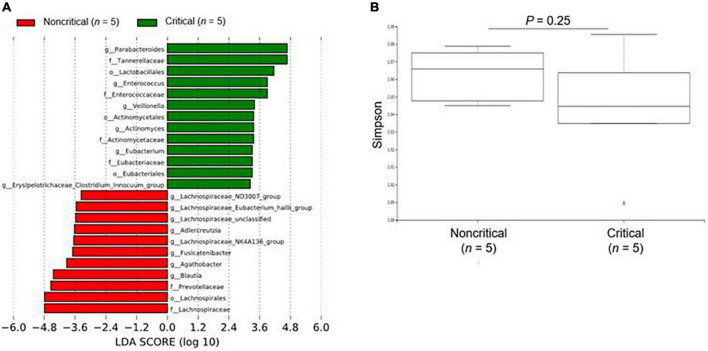
FIGURE 2.
Microbiome analysis of fecal contents from COVID-19 patients. (A) The enriched gut microbiota constituents were identified by linear discriminant analysis (LDA) effect size (LEfSe). The histogram shows taxa with LDA scores with (log 10) values > 3 and P < 0.05. g_ means genus, f_ means family, and o_ means order. (B) The α-diversity represented by the Simpson index. The vertical axis shows the Simpson index. Box-and-whisker plots show the median, 25th and 75th percentiles, with whiskers extending to the minimum and maximum values. Data were analyzed using Mann–Whitney U test. Statistical significance was accepted as P < 0.05.

