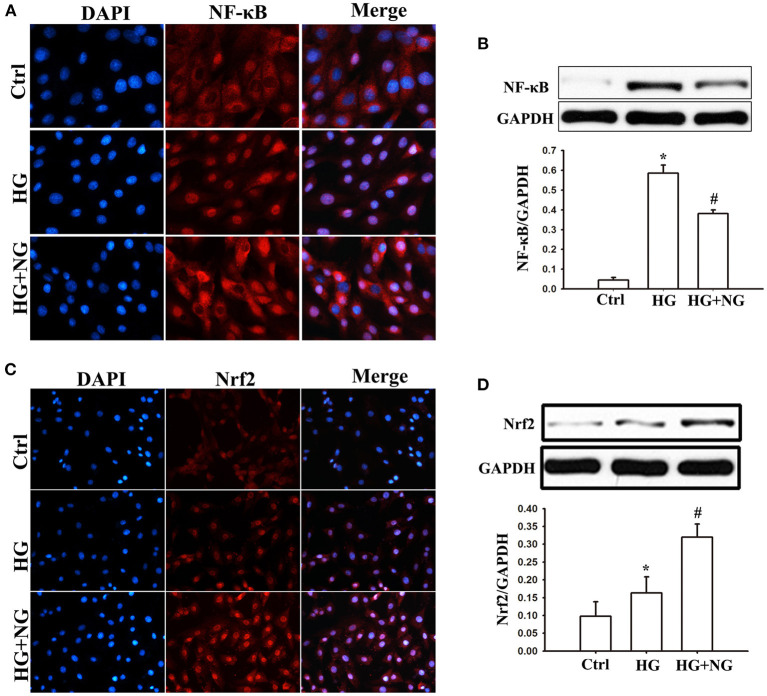
Figure 6.
NG regulates the expression of NF-κB and Nrf2 in H9C2 cells under the HG condition. (A) Representative immunofluorescence staining of NF-κB for each group, fluorescence microscope (200×). (B) Quantitative analysis of the NF-κB protein expression in H9C2 cells. Data are expressed as mean ± SD (n = 3), *P < 0.05 vs. Ctrl group; #P < 0.05 vs. DM group. (C) Representative immunofluorescence staining of Nrf2 for each group, fluorescence microscope (200×). (D) Quantitative analysis of the Nrf2protein expression in H9C2 cells. Data are expressed as mean ± SD (n = 3), *P < 0.05 vs. Ctrl group; #P < 0.05 vs. DM group.

